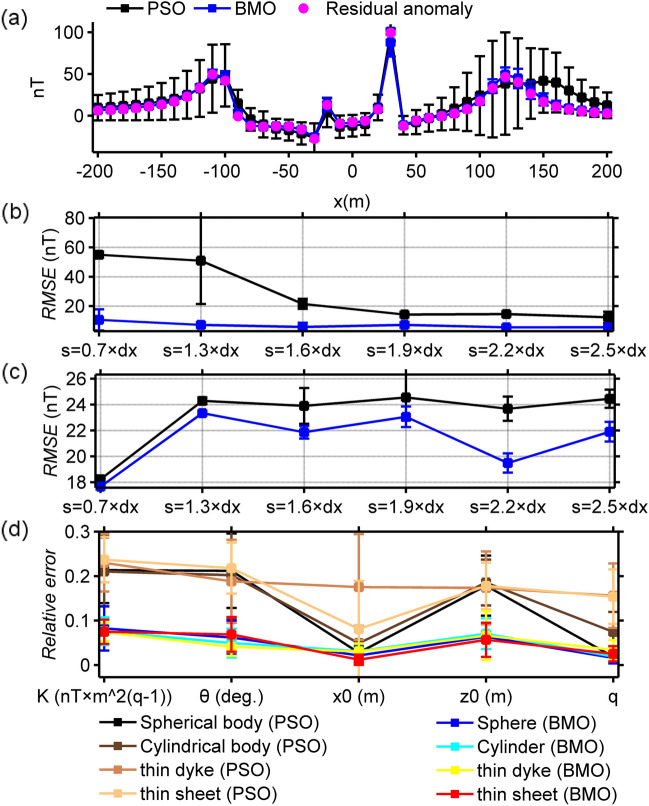
Figure 12.
Inversion results of case 3 with the implementation of the SMA technique. (a) fittings between the residual magnetic anomaly and the responses obtained via BMO and sPSO, (b) variation behaviors of the calculated RMSE values between the uncontaminated magnetic anomaly of case 1 and the residual responses obtained via BMO and sPSO for different s values, (c) variation behaviors of the computed RMSE values between the calculated SMA magnetic anomalies of case 3 and the estimated SMA magnetic responses of BMO and sPSO for different s values, (d) relative errors of the calculated average estimation of the obtained model parameters using BMO and sPSO for four causative sources from the SMA magnetic anomalies for different s values. Error bars are also given in (a)–(d).

