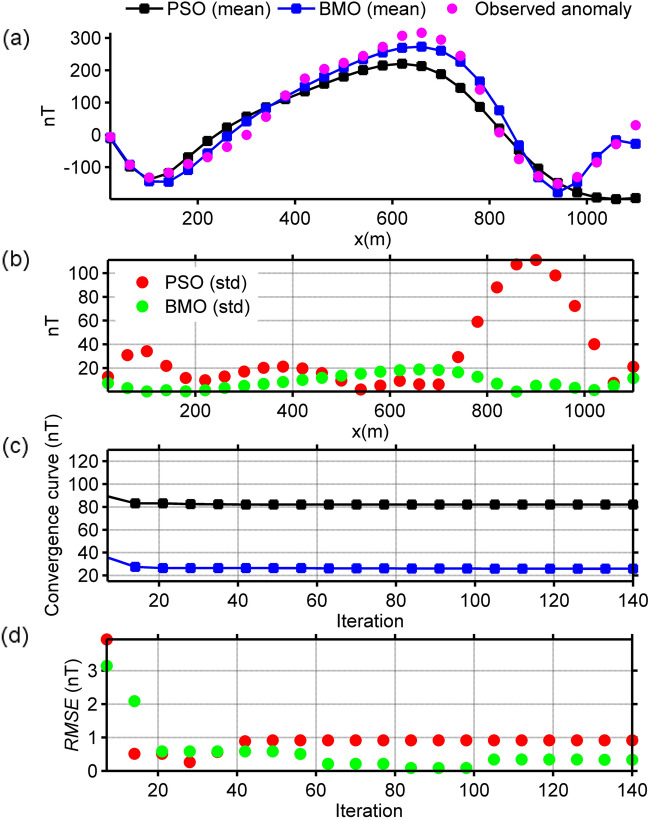
Figure 14.
Inversion results of the chromite ore anomaly, India. (a) fittings between the observed magnetic anomaly and the mean responses obtained via BMO and sPSO, (b) calculated std values of obtained responses at each station, (c) variation behavior of the mean RMSE values against iterations of BMO and sPSO after 30 independent runs, (d) variation behavior of the std of RMSE values against iterations of BMO and sPSO after 30 runs.

