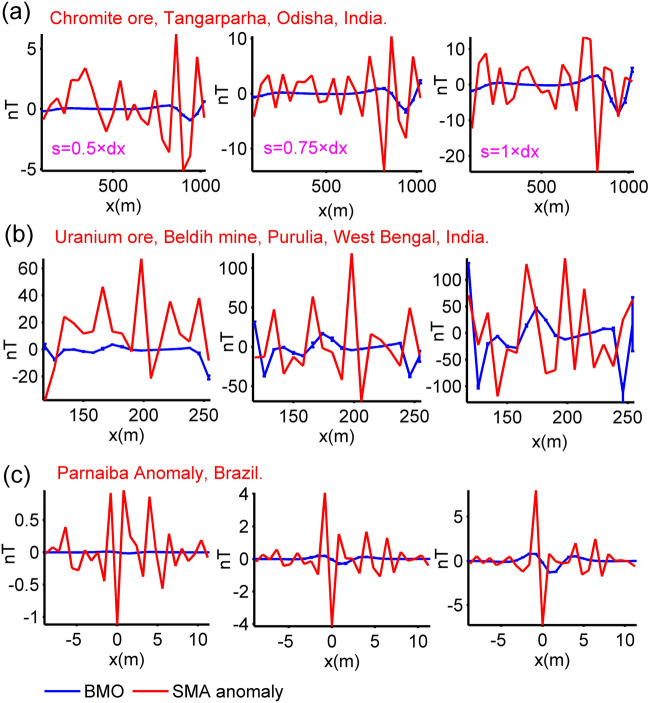
Figure 17.
Inversion results of three field cases obtained via BMO with the implementation of the SMA technique, (a) the calculated SMA magnetic anomalies of the chromite ore anomaly, India and estimated response of BMO for different s values (0.5, 0.75, and 1 × dx, dx = 40 m), (b) the calculated SMA magnetic anomalies of the uranium ore anomaly, India and estimated response of BMO for different s values (0.5, 0.75, and 1 × dx, dx = 8 m), (c) the calculated SMA magnetic anomalies of the Mesozoic dyke anomaly, Brazil and estimated response of BMO for different s values (0.5, 0.75, and 1 × dx, dx = 0.8 m).

