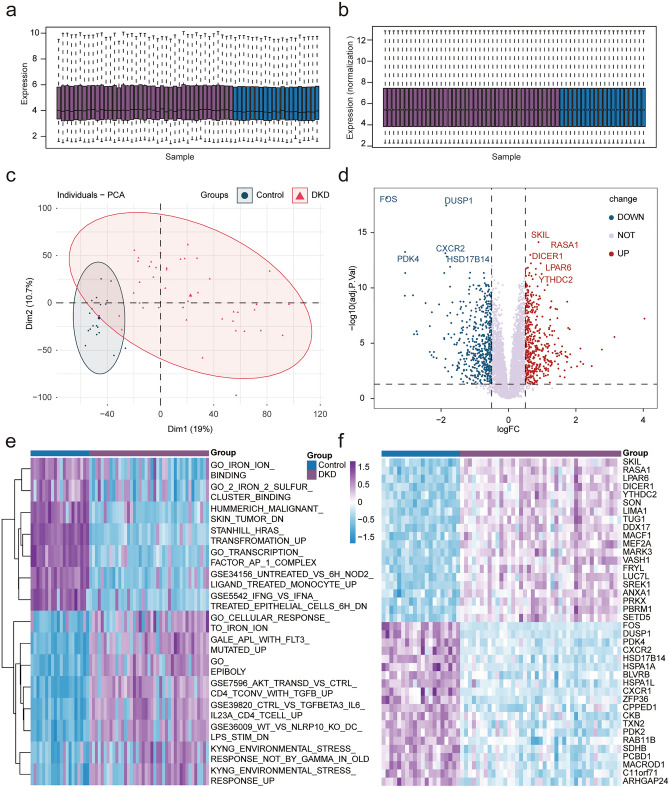
Figure 1.
Differentially expressed genes. (a) Histogram of GSE96804 data set sample expression value, purple represents DKD samples, dark blue represents normal kidney tissue samples (Control). (b) Histogram of GSE96804 data set sample expression value after normalized by limma packets, purple represents DKD samples, dark blue represents normal kidney tissue samples (Control). (c) Principal component analysis, red represents DKD samples and light green represents normal kidney tissue samples (Control). (d) Volcano map of DEGs. The horizontal axis is logFC and the vertical axis is −log10(adj. p). The dotted lines in the figure represent |logFC|> 0.5 and adj. p < 0.01 respectively. Red represents up-regulated genes, blue represents down-regulated genes, and the top five genes’ tags are displayed in adj. p arrangement. (e) Heat map shows the difference of pathway enrichment between the two groups by GSVA, and the top 10 are selected by adj. p arrangement for visualization. (f) Heat map of the DEGs. Purple represents DKD samples, dark blue represents normal kidney tissue samples (Control), and the top 20 genes are visualized by adj. p arrangement. (adj. p < 0.05 was considered statistically significant).

