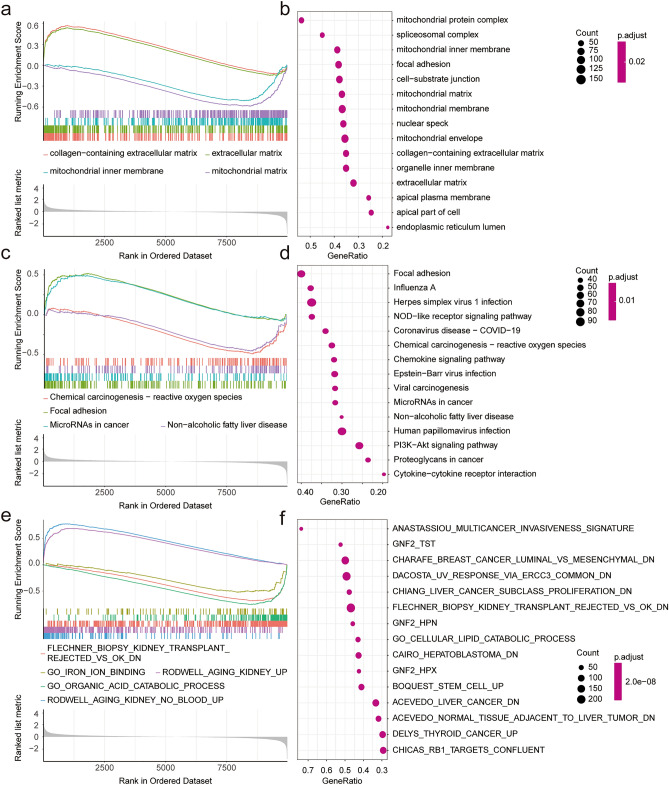
Figure 2.
Function analysis. (a) The GSEA enrichment method was used to annotate the GO gene function of the DEGs, and the two items with the highest and lowest enrichment scores are visualized according to the enrichment scores. (b) The GSEA enrichment method was used to annotate the GO gene function of the DEGs, and the top 15 are visualized according to the enrichment scores. (c) The KEGG pathway enrichment analysis of DEGs was carried out by GSEA enrichment method, and the two items with the highest and lowest enrichment scores are visualized according to the arrangement of enrichment scores. (d) The KEGG pathway enrichment analysis of DEGs was carried out by GSEA enrichment method, and the top 15 are visualized according to the enrichment score. (e) The pathway enrichment analysis of DEGs was carried out according to the MSigDb dataset by the GSEA enrichment method, and the two items with the highest and lowest enrichment scores and ferroptosis related pathway are visualized according to the arrangement of enrichment scores. (f) The pathway enrichment analysis of DEGs was carried out according to the MSigDb dataset by GSEA enrichment method, and the top 15 are visualized according to the enrichment score. (adj. p < 0.05 was considered statistically significant).

