Figure 4.
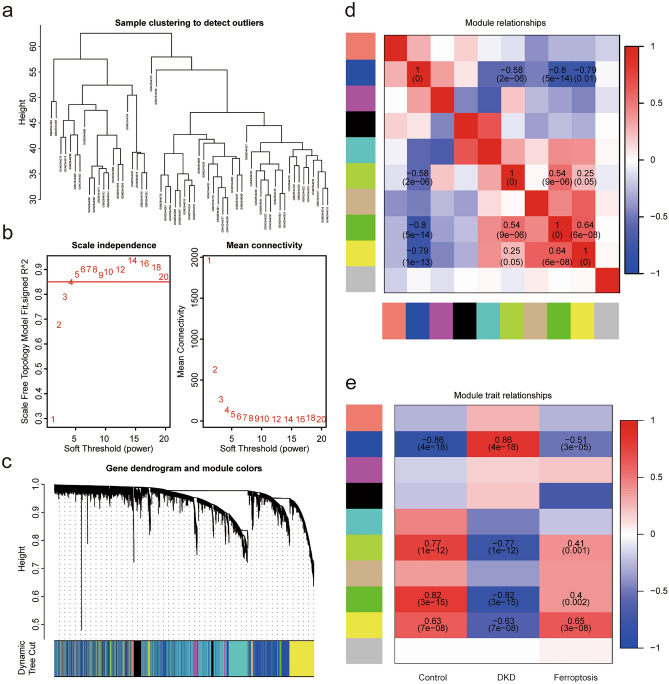
WGCNA recognize and diagnose the ferroptosis related gene set. (a) After removing two samples with great differences according to stagger clustering, the tree view is displayed. (b) Construction of WGCNA gene module, the results suggest that there are 10 gene modules, which are represented by different colors, and gray represents the unclassified genes. (c) Build a scale-free network with five as the best soft threshold. (d) The correlation analysis between modules, red represents positive correlation and blue represents negative correlation. (e) The correlation analysis between modules and clinical features. Red represents positive correlation and blue represents negative correlation. Blue module (3788) is significantly positively correlated with DKD and negatively correlated with ferroptosis, while green module (3788), greenyellow module (114) and yellow module (1237) are just the opposite (p < 0.05 was considered statistically significant).

