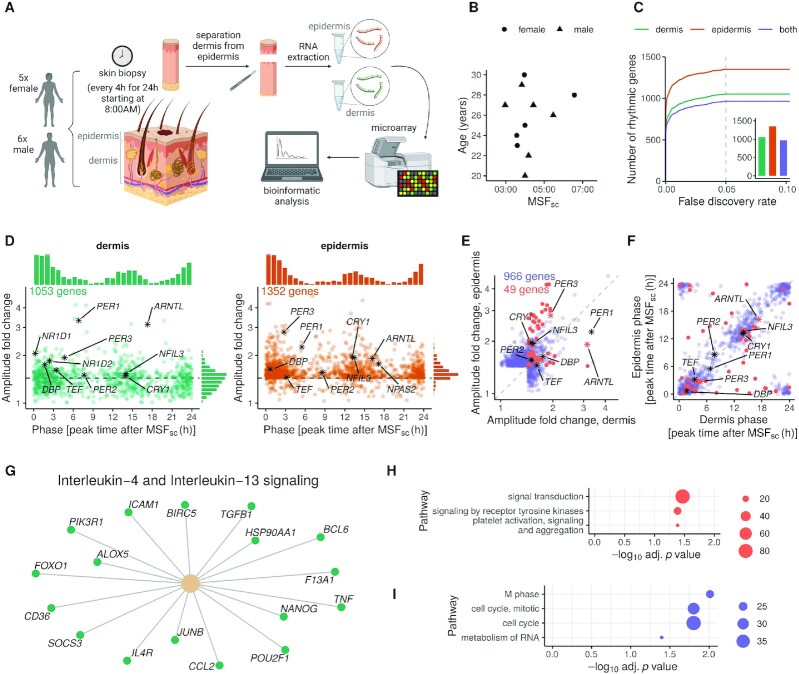
Figure 1.
Functional and layer-specific clocks in human dermis and epidermis. (A) Experimental setup: 11 healthy subjects were biopsied in the back every 4 h for 24 h starting at 8:00. Dermis and epidermis were separated and gene expression was analyzed using whole-genome microarrays. (B) Composition of the study cohort by sex, age and mid-sleep time on free days after correcting for sleep debt (MSFsc). (C) Number of diurnally-rhythmic genes with respect to internal time in dermis, epidermis or in both layers were determined using differential rhythmicity analysis (minimum requirement of peak-to-trough fold change amplitude >1.5 in at least one layer, see Materials and Methods for details). The number of genes for FDR < 0.05 is shown in the inset. (D) Phase (as peak time after MSFsc) and amplitude distributions of the diurnal genes in human dermis (in green, left panel) and epidermis (orange, right panel) (FDR < 0.05, peak-to-trough fold change amplitude > 1.5). Each gene is represented by a dot; clock genes are highlighted in black. (E) Amplitude correlation of the 966 diurnal genes in both layers, from which 49 show significantly different rhythms (highlighted in coral). (F) Phase correlation of diurnal genes in dermis and epidermis, with differentially rhythmic genes highlighted in coral. Clock genes are shown in black asterisks (or coral, if differentially rhythmic). (G) Reactome pathway enrichment analysis of the 1053 diurnal genes in dermis tested against the background of all 11578 expressed genes. (H) Reactome pathway enrichment analysis of the 522 differentially-rhythmic genes in dermis and epidermis tested against the background of all 1439 genes rhythmic in dermis or epidermis. (I) Reactome pathway enrichment analysis of the 917 genes with indistinguishable rhythms in dermis and epidermis tested against the background of all 1439 genes diurnally-rhythmic in dermis or epidermis. Only pathways containing more than 20 genes per set at a P < 0.05 are shown.

