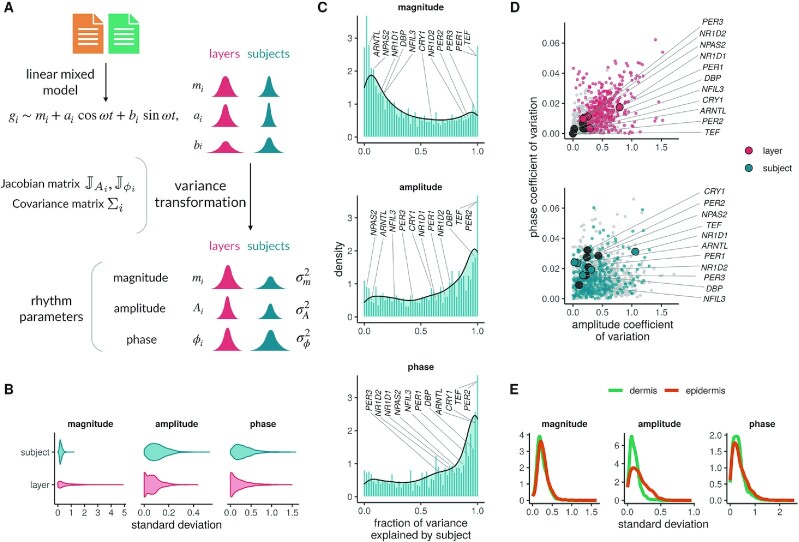
Figure 2.
Variability of diurnal gene expression across layers and subjects. (A) Methodology to compute variability in rhythmic parameters across layers and subjects. (B) Quantification of the variability in magnitude (MESOR), amplitude and phase across subjects (blue) and layers (red) in genes (1439) diurnally-rhythmic in at least one layer. (C) Relative contribution of layer and subject to variation in magnitudes, amplitudes and phases. The fraction of variance explained by subject was defined as  . Diurnal genes falling in bins closer to 0 represent rhythmic genes with low fraction of variance attributed to subject differences (and high fraction of variance explained by layer differences). (D) Correlations of amplitude and phase relative variability (using the coefficient of variation) across layers (top panel) or subjects (bottom panel). Clock genes are shown with larger dots. Differentially-rhythmic genes (from the previous analysis) across layers are shown in color (red, blue), while genes with non-significant rhythm differences in dermis and epidermis are shown in grey. (E) Quantification of the variability in rhythmic parameters across subjects in each skin layer separately. Linear mixed models were fit to all 1439 diurnal genes rhythmic in at least one layer for plot panels B–D; in all 1053 rhythmic genes in dermis and 1352 in epidermis for plot panel E.

