FIGURE 3.
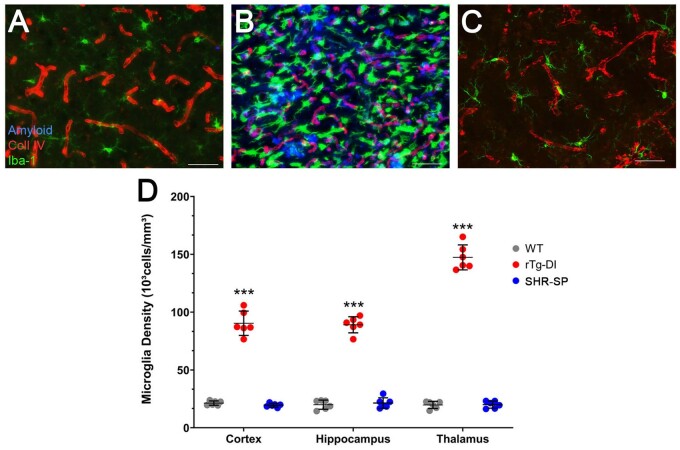
Increased microglia in rTg-DI rats but not in SHR-SP rats. Brain sections from 12-month WT rats (A), rTg-DI rats (B), and SHR-SP rats (C) were labeled with Amylo-Glo to detect microvascular fibrillar amyloid (blue), goat polyclonal antibody to collagen IV to detect cerebral microvessels (red), and rabbit polyclonal antibody to Iba-1 to detect microglia (green). Images from the cortex are shown. Scale bars = 50 µm. (D) Quantitation of microglia numbers in different brain regions from WT rats (gray circles), rTg-DI rats (red circles), and SHR-SP rats (blue circles) at 12 M. Data points show the results from each rat and the group mean±SD of n = 6 rats of each type. ***p < 0.001 determined by 2-way ANOVA.

