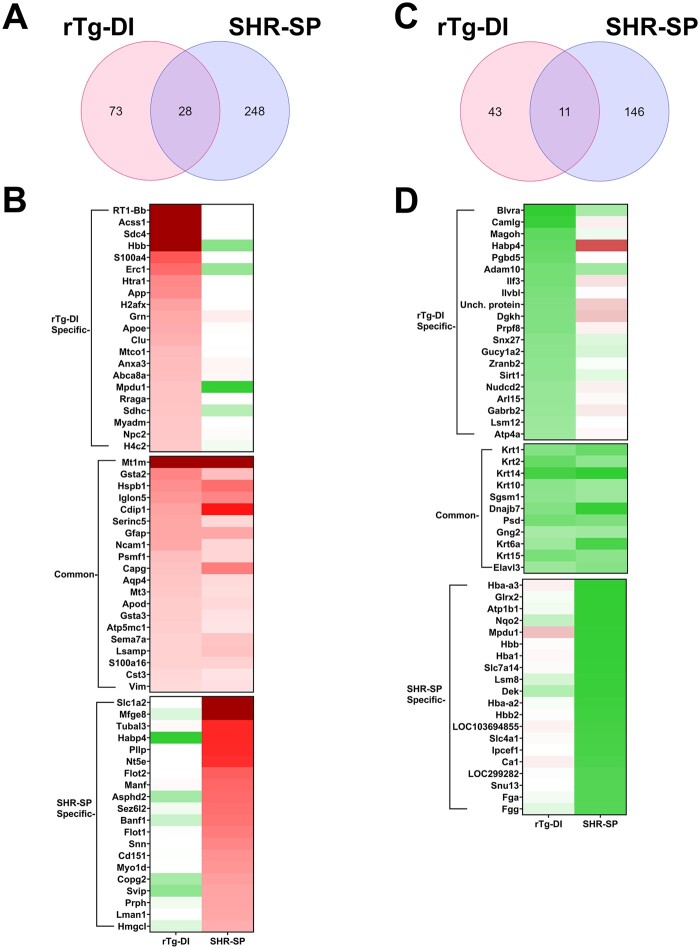
FIGURE 6.
Differentially expressed proteins in SHR-SP and rTg-DI brains. (A) A Venn diagram comparing significantly enhanced proteins by ≥33% of the WT concentration in the rTg-DI and SHR-SP brains (n = 10 for rTg-DI and 6 for SHR-SP, p ≤ 0.05 determined by t-test). (B) Heat map comparing relative expression of the enhanced proteins with the greatest increases specific to the rTg-DI, SHR-SP, and those overlapping between the 2 models. Red indicates enhanced expression, green reduced expression, and color intensity relative to the degree of change. (C) A Venn diagram comparing significantly reduced proteins by ≥33% of the WT concentration in the rTg-DI and SHR-SP brains (n = 10 for rTg-DI and 6 for SHR-SP, p ≤ 0.05). (D) Heat map comparing relative expression of the decreased proteins with the greatest relative decreases specific to the rTg-DI, SHR-SP, and those overlapping between the 2 models. Color shading as in panel (B).

