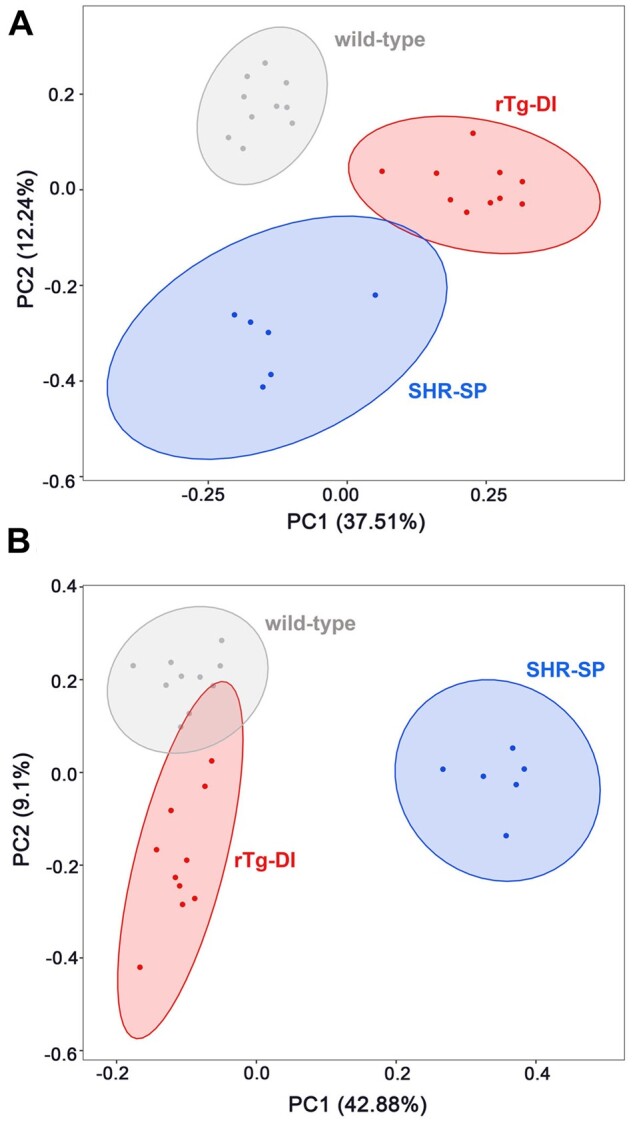
FIGURE 7.

Primary component analysis (PCA) of differentially expressed proteins in the rTg-DI and SHR-SP brains. (A) PCA conducted in RStudio computing software, considering only the DEPs identified in the rTg-DI rats with PC1 accounting for 37.51% and PC2 accounting for 12.24% of the variance. The individual animals and probability ellipses for WT show in gray, rTg-DI red, and SHR-SP blue. (B) PCA conducted in RStudio computing software, considering only the DEPs identified in the SHR-SP rats with PC1 accounting for 42.88% and PC2 accounting for 9.1% of the variance. The individual animals and probability ellipses are indicated as in panel (A).
