
FIGURE 4.
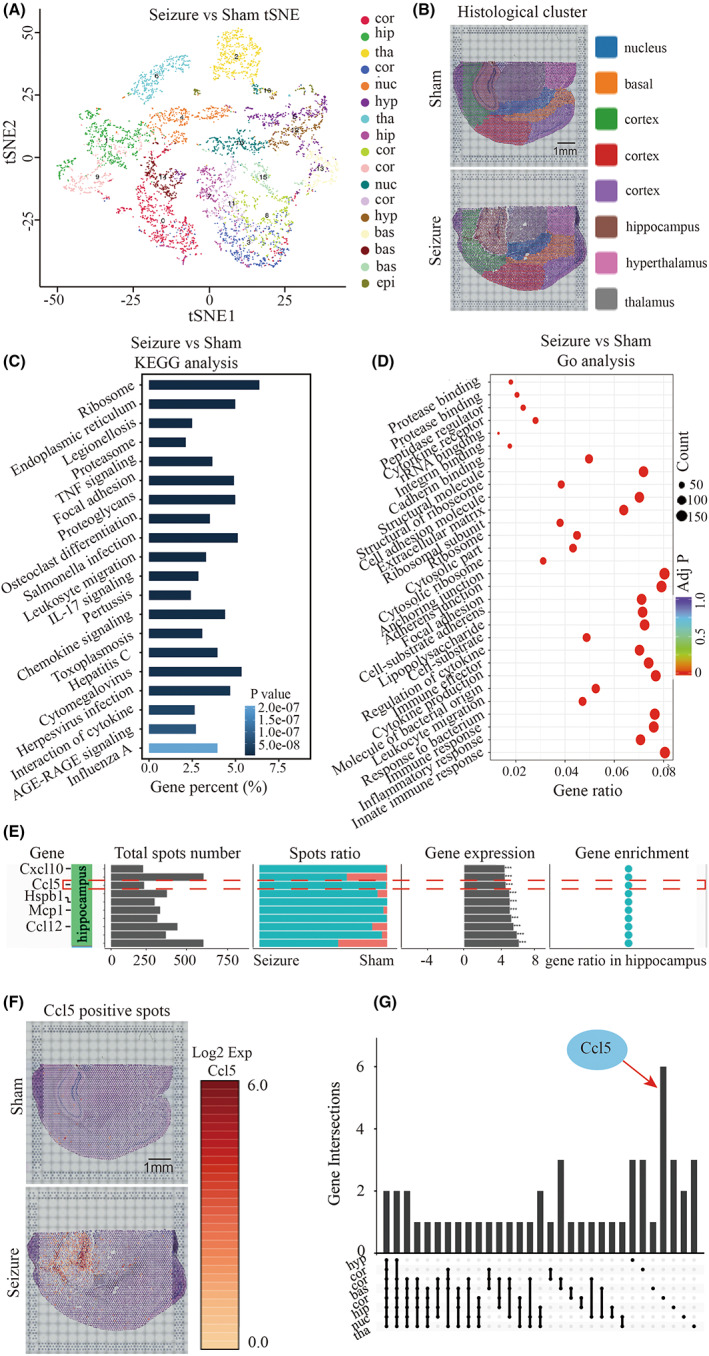
CCL5 is upregulated in the hippocampus of a seizure mouse compared to a sham mouse. A. tSNE analysis of seizure mouse brain comared to sham mouse brain. B. Gene cluster division adapted to anatomical structure. On the basis of differential gene expression distribution, and regions of interest (ROI), regions were divided into the cortex, hippocampus, thalamus, hypothalamus, and nucleus for subsequent analysis. Each color represents a specific anatomical structure. Scale bar, 1 mm. C–D. KEGG and GO analysis of epileptic hippocampus against sham hippocampus. E. Spatial enrichment analysis of the top 10 genes (by expression level) in the hippocampus. The headlines were explained as follows: top 10 upregulated gene names in hippocampus, positive spot number of each gene in both sham and seizure group, positive spot ratio of each gene in seizure mouse compared to sham mouse, gene enrichment in hippocampus. F. The enrichment of CCL5 in epileptic and sham brain. The red highlighted spots represent CCL5 expression at the modified position. Scale bar, 1 mm. G. Venn diagrams showing subsets of gene expression