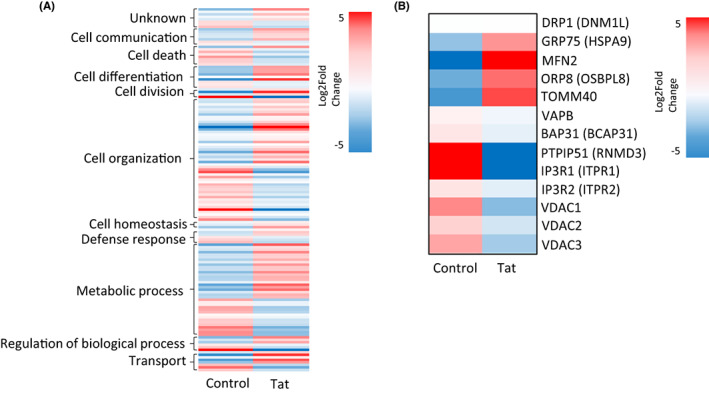
FIGURE 2.

Proteomics analysis displayed as Heatmaps. Heatmaps representing differentially expressed proteins from proteomics analysis organized by (A) cellular functional pathway and (B) association with MAMs between control SH‐SY5Y cells and Tat‐treated cells. Colors represent Log2fold change.
