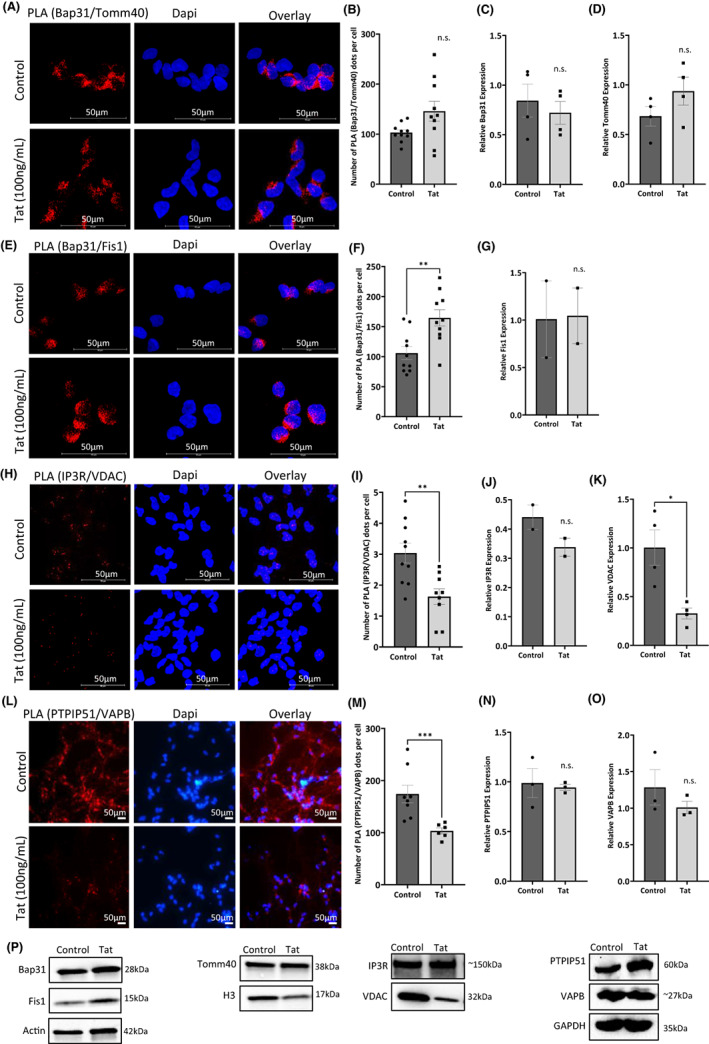
FIGURE 3.

Expression and interaction between MAM tethering proteins in the presence of Tat. Representative images of PLA for the interaction between MAM tethering proteins (A) Bap31 and Tomm40, (E) Bap31 and Fis1, (H) IP3R and VDAC, and (L) PTPIP51 and VAPB in LUHMES cells in the absence and presence of Tat. Red dots indicate individual interactions. DAPI staining indicates individual nuclei. Quantification of assays is represented by bar graphs (B, F, I, and M). Western blot analyses (P) and quantification for the whole cell expression of Bap31 (C), Tomm40 (D), Fis1 (G), IP3R (J), VDAC (K), PTPIP51 (N), and VAPB (O). (NS = not significant; **p < 0.01). Error bars are shown as S.E.M.
