
FIGURE 1.
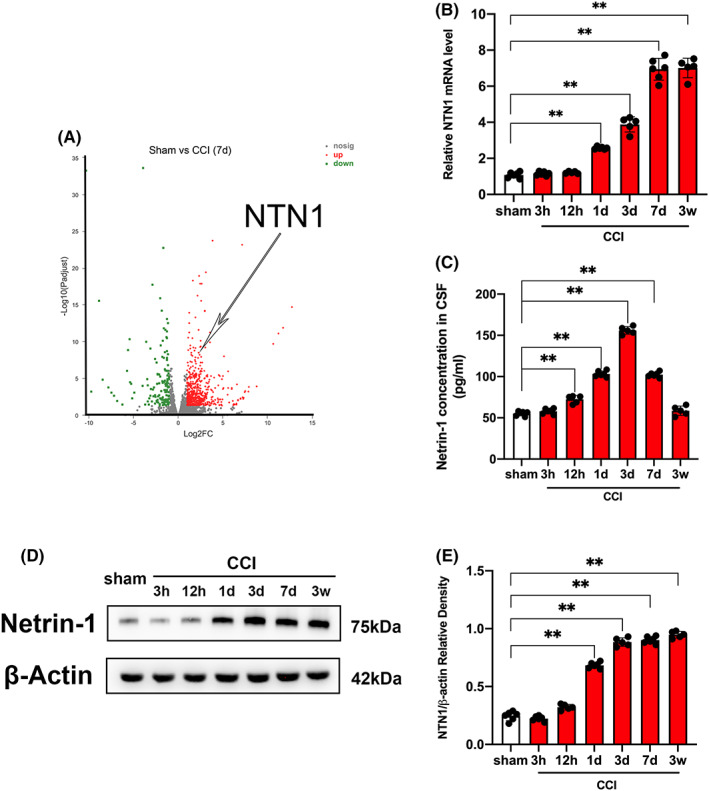
NTN1 expression was upregulated after CCI. (A) Results of RNA sequencing. RNA sequencing was performed on mice injured cortex in sham group (n = 3) and CCI group (n = 6). Volcano plot shows the differentially expressed genes. Each circle represents a gene. Significantly upregulated genes are highlighted in red and downregulated genes are highlighted in green. (B) NTN1 mRNA content at different time points after CCI. Quantitative real‐time PCR was carried out to determine the NTN1 mRNA content. β‐Actin was used as an internal control and the results were presented as fold change of sham group. (C) Cerebrospinal fluid (CSF) levels of NTN1 measured with ELISA. (D, E) NTN1 protein content determined by western blot at different time points after CCI. β‐Actin was used as control. The data for each group conformed to a normal distribution. Data were analyzed using the one‐way ANOVA with LSD post‐hoc test. **p < 0.01. There was no difference in body weight between mice in each group. n = 5 (12 h, 3 days and 3 weeks after CCI, 1 mouse died respectively), n = 6 (sham group, 3 h, 1 and 7 days after CCI).