
FIGURE 4.
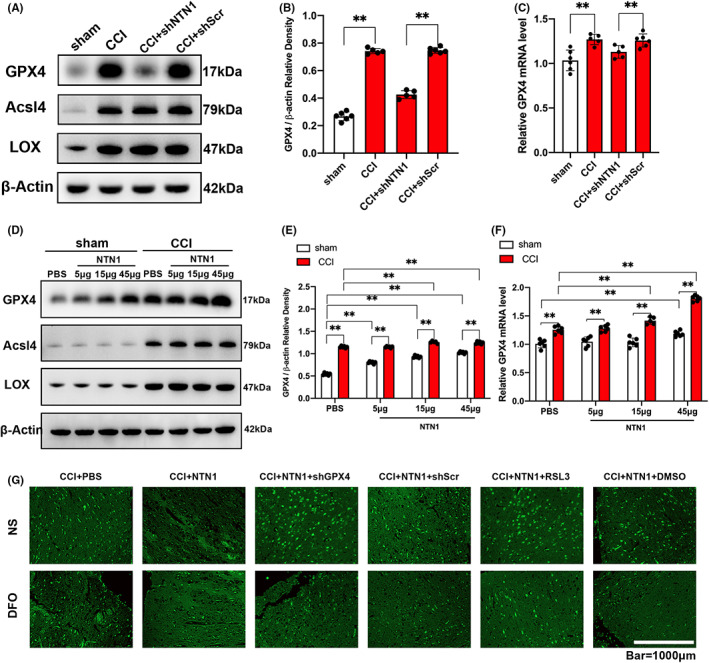
NTN1 ameliorated cortical ferroptosis by upregulating GPX4. (A, B) GPX4, Acsl4 and LOX protein content determined by western blot at 7 days after CCI. β‐Actin was used as control. Histogram shows the quantitative analysis of GPX4 protein content. The data for each group conformed to a normal distribution. p value was determined by ANOVA with LSD post‐hoc test. **p < 0.01. There was no difference in body weight between mice in each group. n = 5 (CCI group and CCI+shNTN1 group, 1 mouse died respectively), n = 6 (sham group and CCI+shScr group). (C) GPX4 mRNA content at 7 days after CCI. Quantitative real‐time PCR was carried out to determine the GPX4 mRNA content. β‐Actin was used as an internal control and the results were presented as fold change of sham group. Data were analyzed using the Mann–Whitney U test. **p < 0.01. There was no difference in body weight between mice in each group. n = 5 (CCI group and CCI+shNTN1 group, 1 mouse died respectively), n = 6 (sham group and CCI+shScr group). (D, E) GPX4, Acsl4 and LOX protein content determined by western blot at 7 days after CCI. β‐Actin was used as control. Histogram shows the quantitative analysis of GPX4 protein content. Data were analyzed using the Mann–Whitney U test. **p < 0.01. There was no difference in body weight between mice in each group. Sham group: n = 6 each. CCI group: n = 5 (CCI+15 μg/kg NTN1 group, 1 mouse died), n = 6 (CCI+PBS group, CCI+5 μg/kg NTN1 group and CCI+45 μg/kg NTN1 group). (F) GPX4 mRNA content at 7 days after CCI. Quantitative real‐time PCR was carried out to determine the GPX4 mRNA content. β‐Actin was used as an internal control and the results were presented as fold change of sham+PBS group. Data were analyzed using the Mann–Whitney U test. **p < 0.01. There was no difference in body weight between mice in each group. Sham group: n = 6 each. CCI group: n = 5 (CCI+15 μg/kg NTN1 group, 1 mouse died), n = 6 (CCI+PBS group, CCI+5 μg/kg NTN1 group and CCI+45 μg/kg NTN1 group). (G) Representative images of Fluoro‐Jade B (FJB) stained brain sections. Scale bar is 1000 μm.