
FIGURE 5.
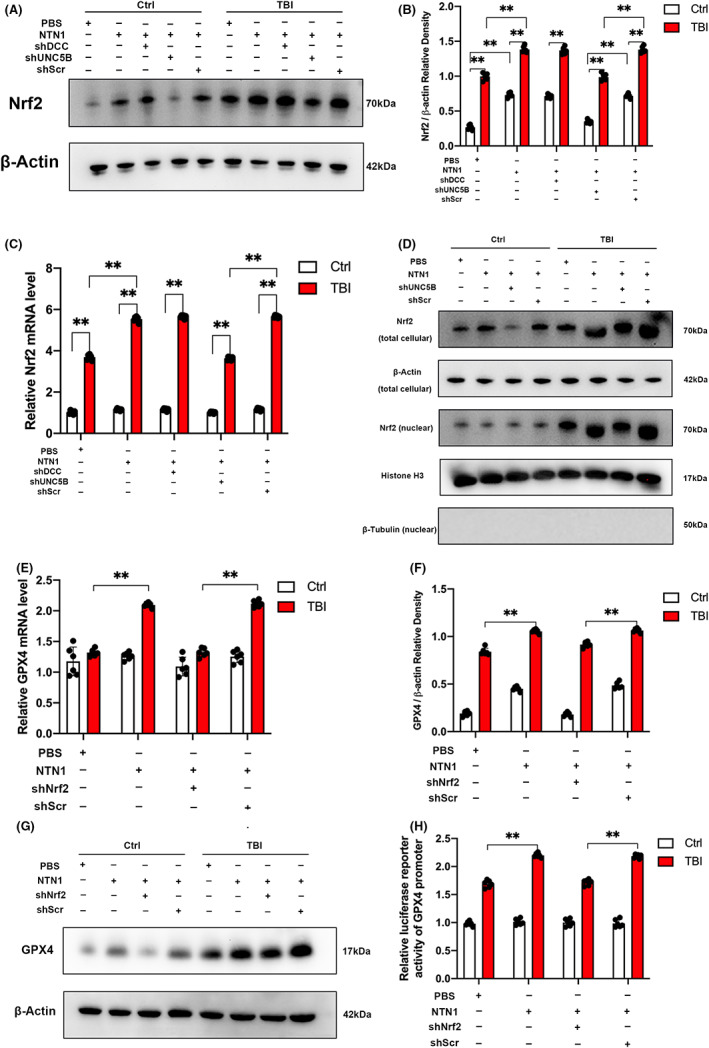
NTN1 upregulated Nrf2 and promoted the Nrf2 nuclear translocation via UNC5B receptor in cell stretch model. Nrf2 enhanced GPX4 transcription in cell stretch model. (A, B) Nrf2 protein content determined by western blot in SH‐SY5Y cell line. β‐Actin was used as control. Data were analyzed using the Mann–Whitney U test. **p < 0.01. (n = 6 each) (C) Nrf2 mRNA content in SH‐SY5Y cell line. Quantitative real‐time PCR was carried out to determine the Nrf2 mRNA content. β‐Actin was used as an internal control and the results were presented as fold change of Ctrl+PBS group. The data for each group conformed to a normal distribution. Data are analyzed using the one‐way ANOVA with LSD post‐hoc test. **p < 0.01. (n = 6 each) (D) Nrf2 protein content determined by western blot in total cellular lysates and nuclear lysates. β‐Actin was used as control in total cellular. Histone H3 and β‐Tubulin was used as control in nuclear. (E) GPX4 mRNA content in SH‐SY5Y cell line. Quantitative real‐time PCR was carried out to determine the GPX4 mRNA content. β‐Actin was used as an internal control and the results were presented as fold change of Ctrl+PBS group. The data for each group conformed to a normal distribution. Data are analyzed using the one‐way ANOVA with LSD post‐hoc test. **p < 0.01. (n = 6 each) (F, G) GPX4 protein content determined by western blot in SH‐SY5Y cell line. β‐Actin was used as control. The data for each group conformed to a normal distribution. Data are analyzed using the one‐way ANOVA with LSD post‐hoc test. **p < 0.01. (n = 6 each) (H) Luciferase reporter activity for promoter of GPX4 gene measured in SH‐SY5Y cell stretch model after Nrf2 shRNA treatment. The results are presented as fold change of Ctrl+PBS group. The data for each group conformed to a normal distribution. Data are analyzed using the one‐way ANOVA with LSD post‐hoc test. **p < 0.01. (n = 6 each).