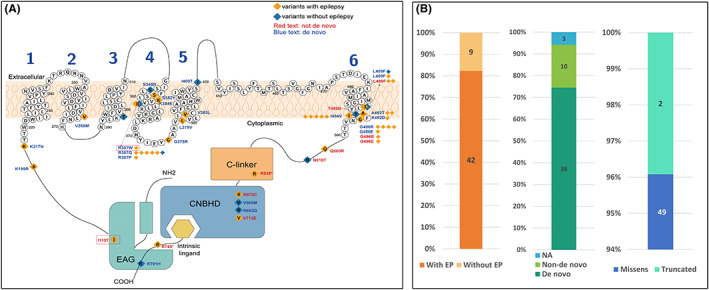
FIGURE 3.

Schematic diagram of variant sites and phenotypes/genotypes characteristics of the patients reported to date. (A) Schematic diagram of the transmembrane structure. The CNBHD, C‐linker, and EAG domains were shown in the picture. The S1–S4 segments act as voltage‐sensor domains. The KCNH1 channel shows the location of the residues affected in individuals with (orange square) or without (blue square) epilepsy. Most of them were de novo variants (blue text), and few were inherited or not known (red text). Variants in our patients were highlighted with red boxes. (B) Showed the clinical phenotypes, and genetic characteristics of the patients reported to date
