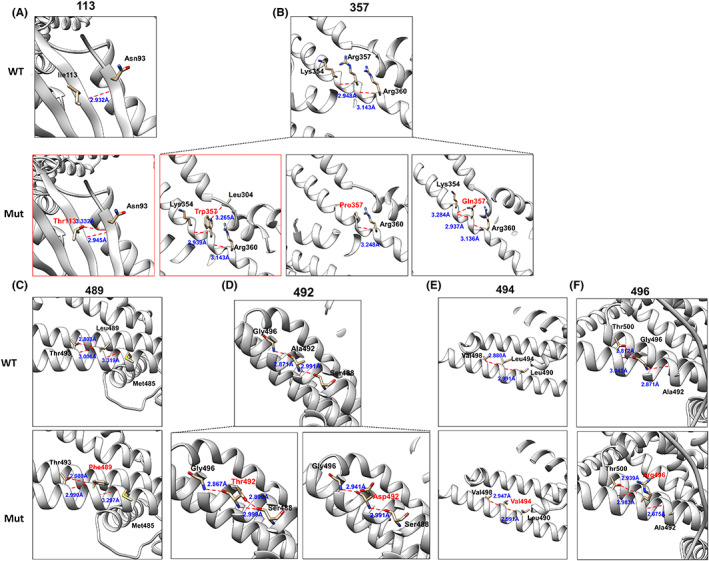
FIGURE 4.

Changes in KCNH1 protein structure. (A–F) The protein changes including our variants and five hotspots (p.Arg357, p.Leu489, p.Ala492, p.Leu494, and p.Gly496). The wild‐type protein structures were shown in the top row, and the mutant structures were in the row below. Hydrogen bonds are represented by red dashed lines and the distances are highlighted with blue text. Structures in our patients were highlighted with red boxes.
