
Figure 1.
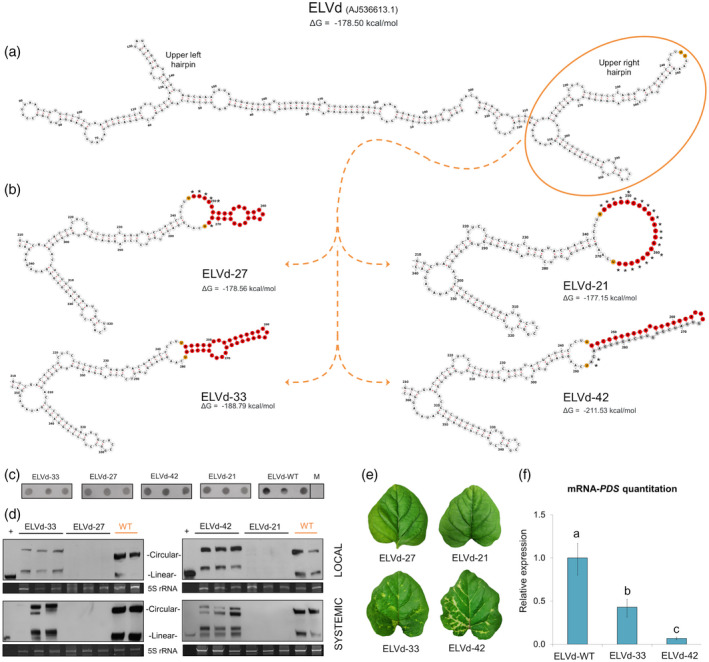
Stability of insertions into the eggplant latent viroid (ELVd) genome and induced silencing of the phytoene desaturase (PDS) gene.
Secondary structures predicted for the complete unmodified ELVd‐WT (accession AJ536613.1) (a) and the partial ELVd region, orange circle, surrounding the artificial 21‐, 27‐, 33‐ and 42‐nucleotide (nt) insertions (b). Secondary structures were obtained with mfold at 25°C and displayed with forna. The minimal free energy of the complete structures is indicated. The nucleotide positions 245 and 246 of ELVd‐WT (between which the artificial sequences were inserted) are depicted in orange. The nucleotides designed to target the PDS are depicted in red. In the case of the 42‐nt insertion, the complementary nucleotides necessary to form a hairpin‐like structure are in gray. The nucleotides of the artificial insertions that enlarge the terminal loop of ELVd‐WT are marked with an asterisk.
(c) Dot blot hybridization of RNA extracted from inoculated cotyledons of three bio‐replicates per construct at 2 days post‐inoculation (dpi). A mock sample (M) was used as a negative control.
(d) Northern blot of total RNA extracted from inoculated (6 dpi) and apical (25 dpi) tissue. The first lane corresponds to monomeric linear transcript of ELVd used as a positive control (+). The hybridization was performed with a DIG‐labeled riboprobe for detecting ELVd plus strand. An image of the acrylamide gel stained with ethidium bromide is shown below as a loading control. Note the presence, in the modified ELVd chimeras, of circular and linear forms larger than the monomeric ELVd‐WT (circular and linear) or control (only linear).
(e) Phenotype of the apical leaves of plants inoculated with the four modified ELVd variants at 25 dpi.
(f) Histogram showing the relative accumulation of PDS transcripts [estimated by reverse transcriptase‐quantitative polymerase chain reaction (RT‐qPCR)] in the first apical leaves of eggplants inoculated with ELVd‐42 and ELVd‐33 in comparison with ELVd‐WT. Different letters indicate significant differences (P < 0.05), estimated by one‐way analysis of variance (anova) and Fisher's Least Significant Difference (LSD). Error bars represent the standard error values. [Colour figure can be viewed at wileyonlinelibrary.com]