
Figure 2.
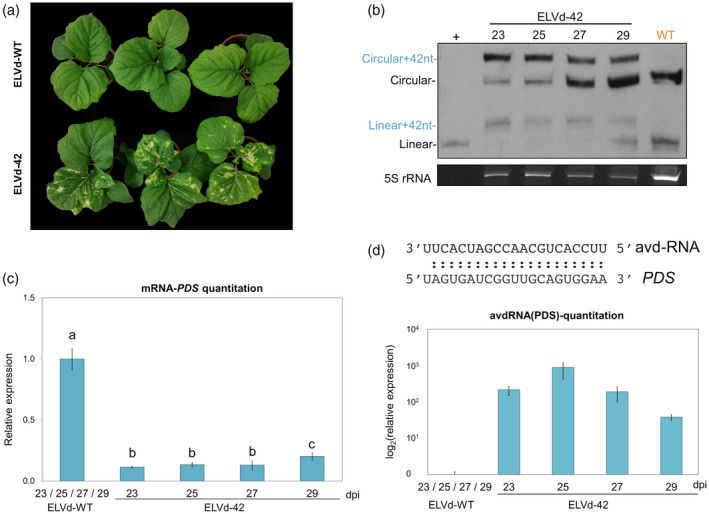
Progression of the silencing of the phytoene desaturase (PDS) induced by an artificial viroid‐derived sRNA.
(a) Phenotype of representative plants inoculated with ELVd‐WT (upper) and ELVd‐42 (lower) at 25 days post‐inoculation (dpi).
(b) Northern blot of RNA extracted from apical leaves of three plants inoculated with ELVd‐42 at 23, 25, 27 and 29 dpi, and an RNA mix of three plants infected with ELVd‐WT at these same time‐points. The first lane corresponds to monomeric linear transcript of ELVd used as a positive control (+). Circular and linear forms are marked in blue (ELVd‐42) and in black (ELVd‐WT). The hybridization was performed with a DIG‐labeled riboprobe for detecting ELVd plus strand. An image of the acrylamide gel stained with ethidium bromide is shown below as a loading control.
(c) Histogram showing the means of the relative accumulation of PDS transcripts [estimated by reverse transcriptase‐quantitative polymerase chain reaction (RT‐qPCR)] in the first apical leaves of three eggplants inoculated with ELVd‐42 at 23, 25, 27 and 29 dpi. The mean of the values obtained from three plants inoculated with WT‐ELVd at comparable dpi was used as reference value.
(d) Graphic representing the quantitation of the artificial viroid‐derived small RNA (avd‐RNA) designed to silence the PDS mRNA in the infected plants by stem‐loop RT‐qPCR. The sequence of the avd‐RNA and the target region in the mRNA of PDS are indicated above. Different letters indicate significant differences (P < 0.05), estimated by one‐way analysis of variance (anova) and Fisher's Least Significant Difference (LSD). Error bars represent the standard error values. [Colour figure can be viewed at wileyonlinelibrary.com]