
FIGURE 3.
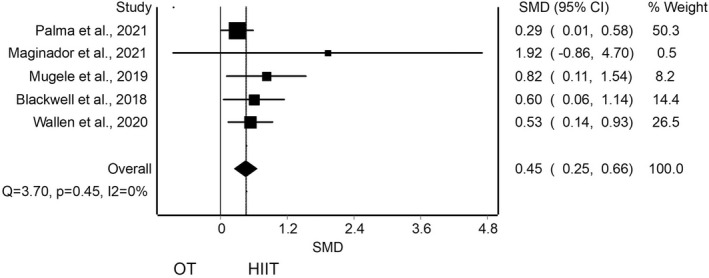
Synthesis forest plot for cardiorespiratory fitness for high‐intensity interval training (HIIT) against other treatment (OT). This forest plot summarizes the results of included studies (standardized mean differences [SMDs], and weight). The small boxes with the squares represent the point estimate of the effect size and sample size. The lines on either side of the box represent a 95% confidence interval (CI)