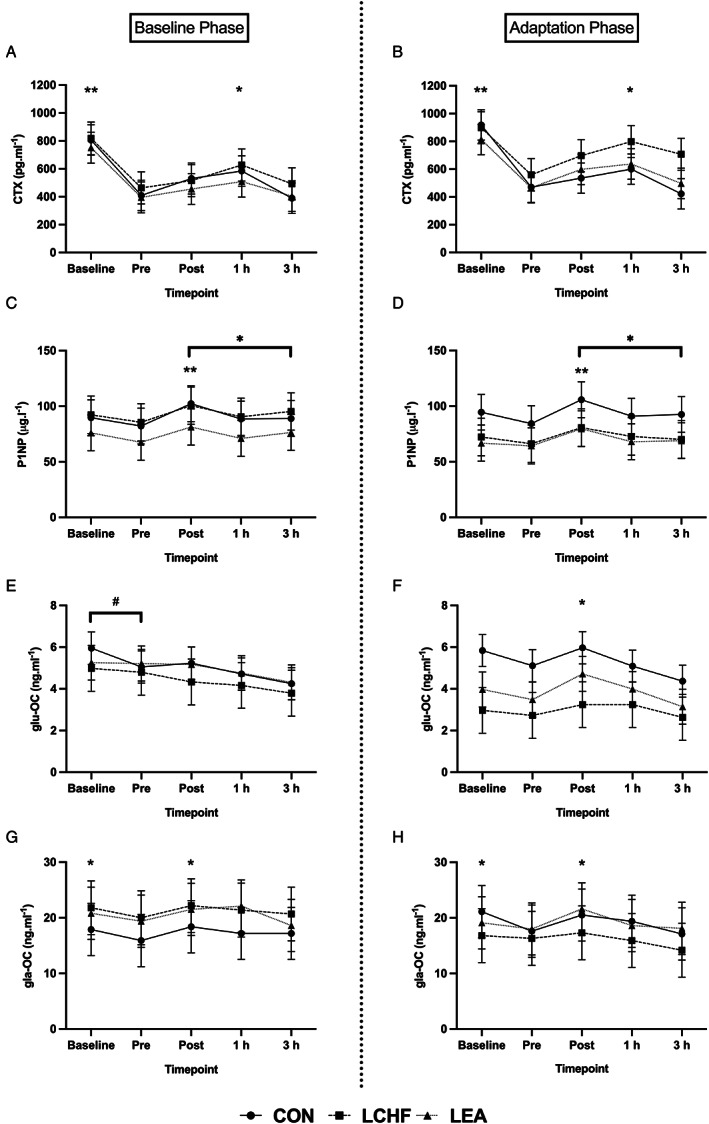
Fig. 3.

Concentration of bone turnover markers for each diet group in each phase across time. 3A and 3B: CTX concentrations across time per group in the Baseline and Adaptation phases, respectively. 3C and 3D: P1NP concentrations across time per group in the Baseline and Adaptation phases, respectively. 3E and 3F: glu‐OC concentrations across time per group in the Baseline and Adaptation phases, respectively. 3G and 3H: gla‐OC concentrations across time per group in the Baseline and Adaptation phases, respectively. *Time effect: Significantly higher than pre‐exercise in all groups (p < 0.05). **Time effect: Significantly higher than all other time points in all groups (p < 0.05). #Time by trial effect: Significantly higher than adaptation at specific time point (p < 0.05). CON = high energy/high carbohydrate; CTX = carboxy‐terminal telopeptide; gla‐OC = carboxylated osteocalcin; glu‐OC = undercarboxylated osteocalcin; LCHF = low carbohydrate/high fat; LEA = low energy availability; P1NP = procollagen‐1 N‐terminal peptide.
