
Fig. 4.
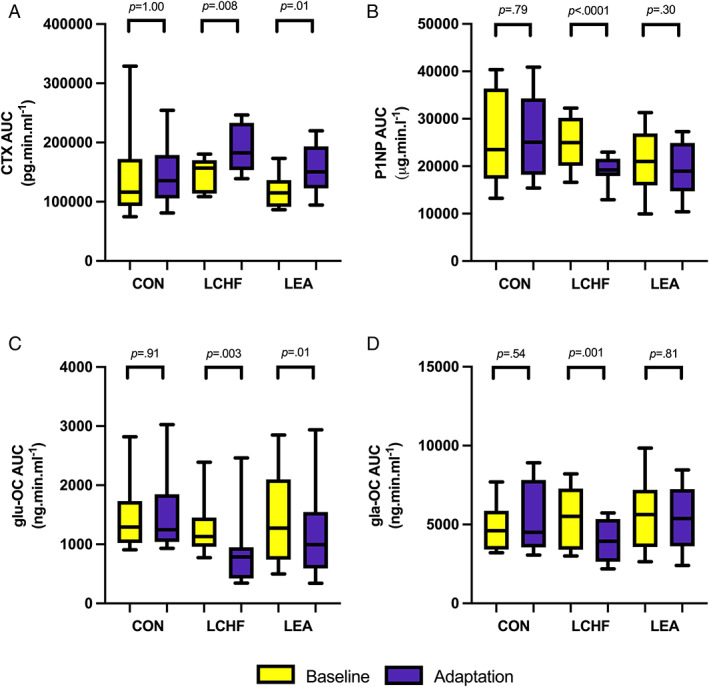
Exercise‐related area under the curve concentrations of bone turnover markers (pre‐exercise to 3 hours post‐exercise) for each diet group in each phase. (A) CTX AUC per group in the Baseline and Adaptation phases. (B) P1NP AUC per group in the Baseline and Adaptation phases. (C) glu‐OC AUC per group in the Baseline and Adaptation phases. (D) gla‐OC AUC per group in the Baseline and Adaptation phases. Raw data presented in box plot as median, upper and lower quartiles, and minimum and maximum. Values of p represent difference from baseline to adaptation. AUC = area under the curve; CON = high energy/high carbohydrate; CTX = carboxy‐terminal telopeptide; gla‐OC = carboxylated osteocalcin; glu‐OC = undercarboxylated osteocalcin; LCHF = low carbohydrate/high fat; LEA = low energy availability; P1NP = procollagen‐1 N‐terminal peptide.