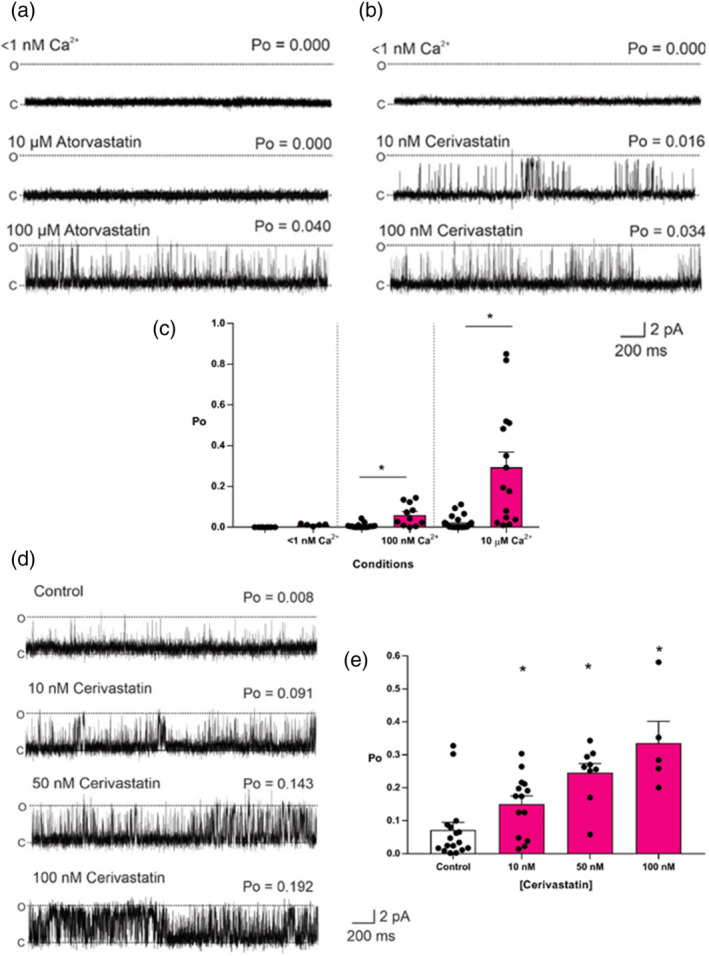
FIGURE 4.

The Ca2+‐dependency of statin ryanodine RyR1 activity. Representative sheep skeletal muscle RyR1 single channel fluctuations at subactivating [Ca2+] < 1 nM Ca2+ (top trace) are shown and after addition of cytosolic atorvastatin (a) or cerivastatin (b) as indicated. Note the difference in concentrations between atorvastatin and cerivastatin. O and C indicate the open and closed channel levels, respectively. The Po above each trace refers to the value determined over 3 min. (c) Mean Po values for RyR1 channels before (white bars) and after (pink bars) addition of 100 nM cerivastatin at the free [Ca2+] indicated. Mean ± SEM; *p < .05 relative to respective controls; n (<1 nM Ca2+ 11; 100 nM 9; 10 μM 6). (d) Representative sheep skeletal muscle RyR1 single channel fluctuations under control conditions (100‐nM cytosolic Ca2+, 1‐mM free Mg2+ and 5‐mM ATP) (top trace) and after addition of cytosolic cerivastatin as indicated. O and C indicate the open and closed channel levels, respectively. The Po above each trace refers to the value determined over 3 min. (e) Mean RyR1 Po values under control conditions (100‐nM cytosolic Ca2+, 1‐mM free Mg2+ and 5‐mM ATP) and after the subsequent addition of cerivastatin as indicated. Mean ± SEM; *p < .05; n (control 32; 10 nM 28; 50 nM 25; 100 nM 15)
