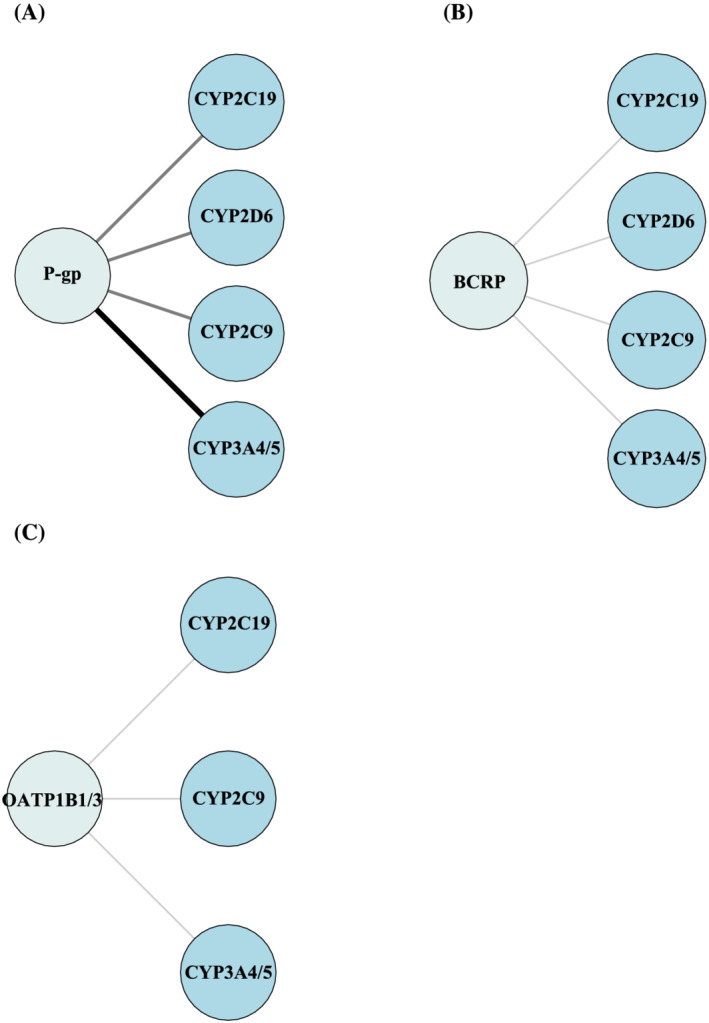
FIGURE 5.

(A) Substrate overlap between P‐gp and CYP3A4/5, CYP2C9, CYP2C19 and CYP2D6. (B) Substrate overlap between BCRP and CYP3A4/5, CYP2C9, CYP2C19 and CYP2D6. (C) Substrate overlap between OATP1B1/3 and CYP3A4/5, CYP2C9 and CYP2C19. The size and darkness of the lines between drug transporter and enzymes illustrate the substrate overlap. Thin/light‐grey line corresponds to 1–5 drugs as substrate overlap. Medium/grey line corresponds to 6–10 drugs as substrate overlap. Thick/black line corresponds to >10 drugs as substrate overlap. BCRP, breast cancer resistance protein; CYP, cytochrome P450 enzyme; OATP, organic anion transporting polypeptide; P‐gp, P‐glycoprotein.
