
Figure 2.
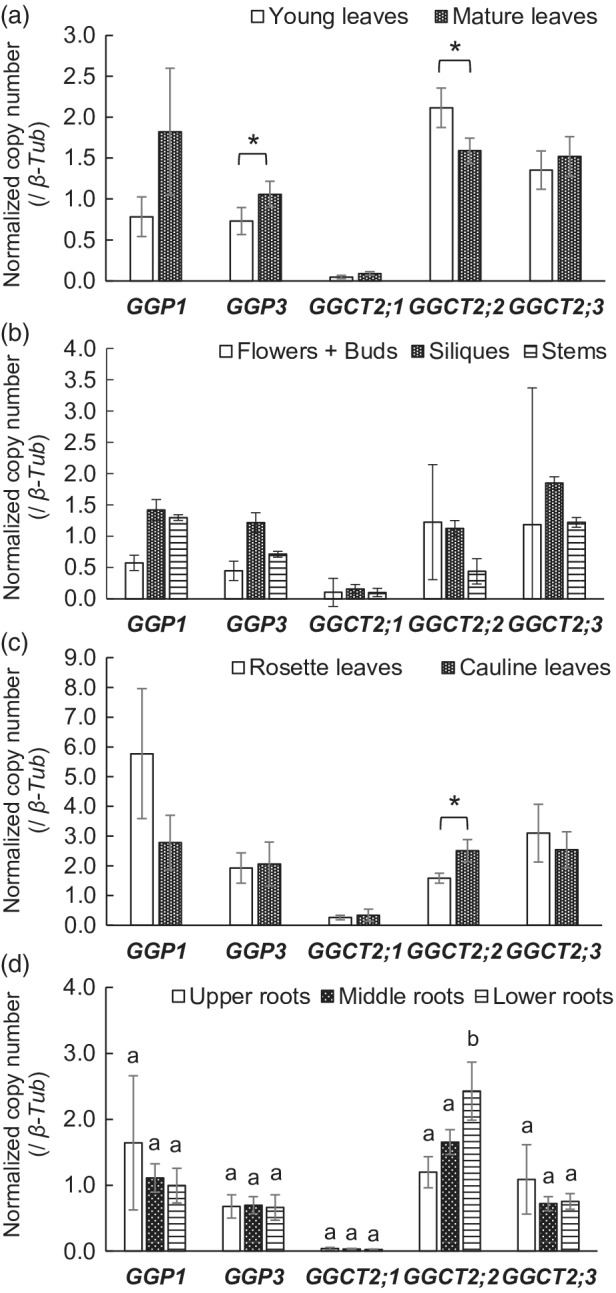
Normalized copy numbers of GGP1, GGP3, GGCT2;1, GGCT2;2, and GGCT2;3 transcripts in various organs of wild‐type (WT) plants. Plants were grown in hydroponic culture. Transcript copy numbers of GGP1, GGP3, GGCT2;1, GGCT2;2, and GGCT2;3 were analyzed by quantitative RT‐PCR using the absolute quantification method and normalized to β‐tubulin. (a) Comparison of young and old leaves from the vegetative‐stage samples. (b–d) Results of the reproductive‐stage samples. (b) Results of flowers/buds, siliques, and stems. (c) Comparison of the rosette and cauline leaves of reproductive‐stage samples. (d) Comparison of the upper, middle, and lower roots of the reproductive‐stage samples. The values and error bars represent the mean and standard deviation of four or five biological replicates. In (a) and (c), asterisks indicate significant differences (Student's t‐test, P < 0.05). In (d), different letters indicate significant differences (Tukey's test, P < 0.05).