
Figure 3.
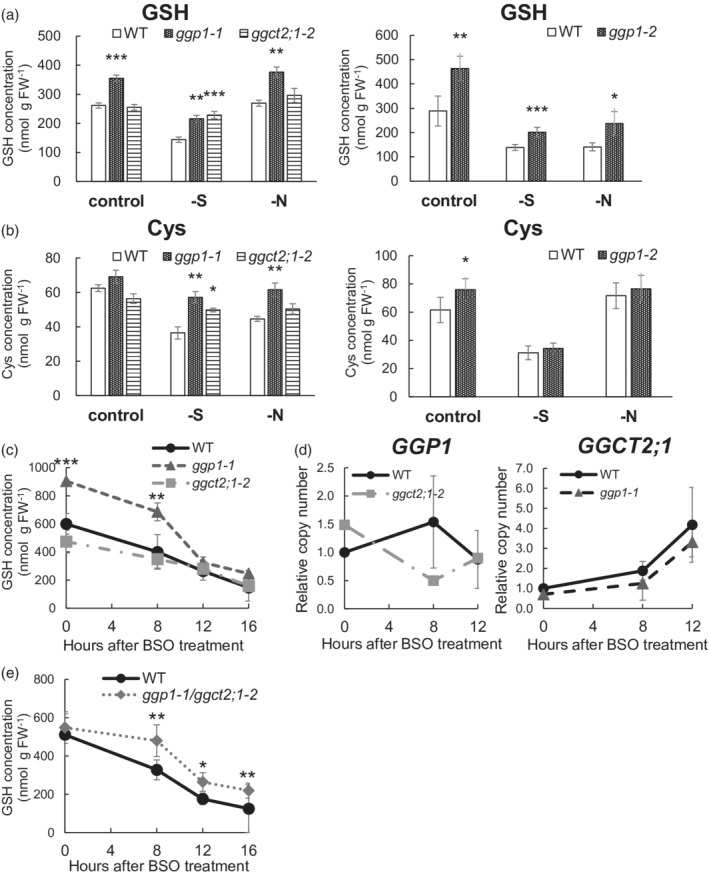
Impact of GGP1 or GGCT2;1 perturbation on GSH metabolism. (a) GSH concentration of ggp1‐1 and ggct2;1–2 (left) and ggp1‐2 (right) mutants. (b) Cys concentration of ggp1‐1 and ggct2;1–2 (left) and ggp1‐2 (right) mutants. (c) Time‐dependent changes in GSH concentration after buthionine sulfoximine (BSO) treatment in the ggp1 and ggct2;1 mutants. (d) Time‐dependent changes in the relative expression of GGP1 (left) and GGCT2;1 (right) after BSO treatment. (e) Time‐dependent changes in GSH concentration after BSO treatment in the ggp1/ggct2;1 double mutant. The values and error bars represent the mean and standard deviation of four to five biological replicates. Asterisks indicate significant differences from the wild type; *P < 0.05, **P < 0.01, Dunnett's test (left figures of (a), (b), and (c)) or Student's t‐test (right figures of (a), (b), and (e)).