
Figure 5.
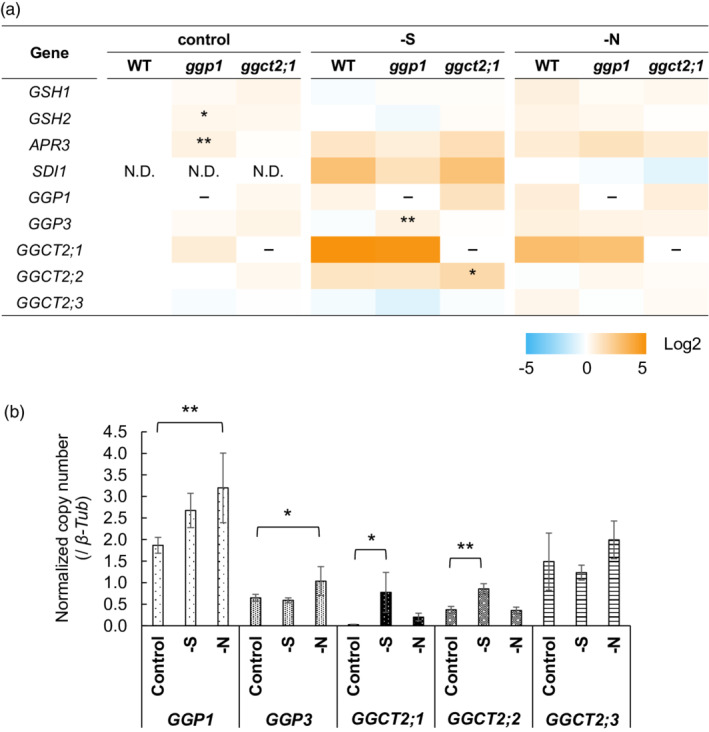
Gene expression levels in the wild type (WT) and the ggp1 and ggct2;1 mutants under normal, sulfur‐deficient, or nitrogen‐deficient conditions. Plants were grown by liquid culture for 14 days, and gene expression levels were analyzed by quantitative RT‐PCR using the absolute quantification method (n = 4–6). Expression levels were normalized to β‐tubulin. (a) Relative gene expression compared with the WT grown under control conditions (or nitrogen deficiency for SDI1) (logarithmic scale). Asterisks indicate significant differences from the WT grown under the same conditions; *P < 0.05, **P < 0.01, Dunnett's test. (b) Detailed results of GGP and GGCT expression levels in the WT (linear scale). The values and error bars represent the mean and standard deviation. Asterisks indicate significant differences from the WT grown under control conditions; *P < 0.05, **P < 0.01, Dunnett's test.