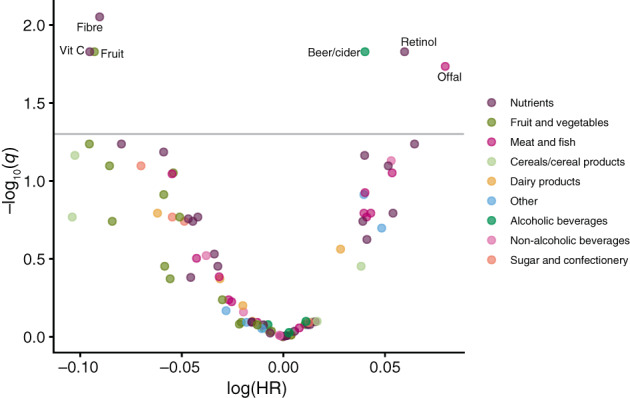
FIGURE 1.

Volcano plot of estimates and q‐values from the diet‐wide association study of 92 foods and nutrients in relation to lung cancer risk in the European Prospective Investigation into Cancer and Nutrition. The y‐axis is the negative log10 transformation of the estimated q‐value, and the x‐axis is the estimated log hazard ratio for lung cancer in relation to a 1 SD increment in intake per day. The horizontal line indicates the false discovery rate threshold of 0.05. Each dietary factor was analysed one at a time, and ordered left to right according to the lowest to highest HR. Estimates are from Cox proportional hazards models stratified by age at recruitment (<40, 40 to <45, 45 to <50, 50 to <55, 55 to <60, 60 to <65, 65 to <70, 70 to <75, ≥75 years), study centre, sex and smoking status (never, former, current) and adjusted for number of cigarettes smoked per day (fourths) interacted with smoking status, cigarette smoking years (fourths) interacted with smoking status, body mass index (<20, 20 to <23, 23 to <25, 25 to <30, 30 to <35, ≥35 kg/m2), physical activity (inactive, moderately inactive, moderately active, active), highest level of education (none/primary school, technical/professional school, secondary school, longer education including university), history of diabetes (no, yes) and energy intake (kcal/day, continuous). The six dietary factors that were carried forward for replication in the NLCS are labelled
