FIGURE 1.

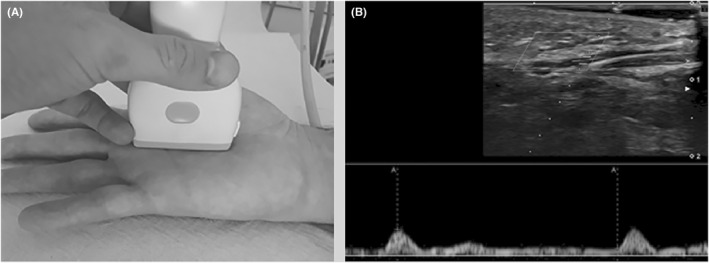
Peak velocity and proximal resistive index. (A) Photograph demonstrates the position of the probe at the third interdigital space. (B) Spectral analysis performed with an 18‐5 MHz ultrasound transducer

Peak velocity and proximal resistive index. (A) Photograph demonstrates the position of the probe at the third interdigital space. (B) Spectral analysis performed with an 18‐5 MHz ultrasound transducer