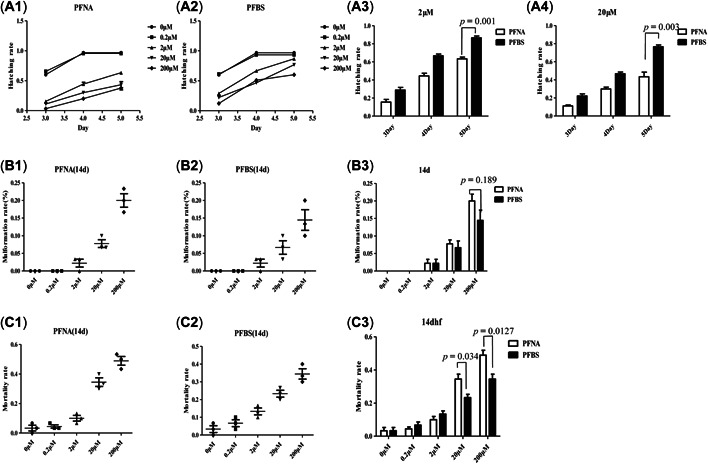
Figure 1.

Effects of perfluorononanoic acid (PFNA) and perfluorobutane sulfonic acid (PFBS) exposure on zebrafish embryos. (A) Line chart describing the hatchability of PFNA (A1)‐ and PFBS (A2)‐treated embryos between 3 and 5 days postfertilization (dpf), and a bar graph comparing the values at 2 µM (A3) and 20 µM (A4). (B) The malformation rates of the PFNA (B1)‐ and PFBS (B2)‐exposed zebrafish embryos were evaluated over 14 days at each concentration, and the differences in rates are illustrated in the bar graph for PFNA and PFBS (B3). (C) The mortality rates of the zebrafish embryos over the 14‐day evaluation (PFNA (C1) and PFBS (C2)), illustrated in a bar graph (C3).
