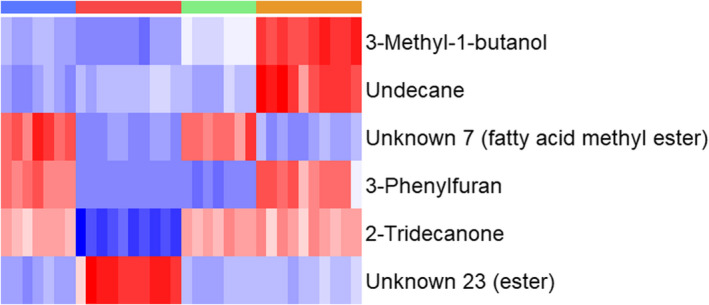
FIGURE 5.

Heat map generated using hierarchical clustering analysis for the differentiation between AmpC‐producing and nonproducing Escherichia coli BL21 strains when treated with and without 2 μg ml−1 ampicillin using the top six identified compounds. Groups are represented in columns left to right by blue: BL21 (untreated), red: BL21 (2 μg ml−1 ampicillin), green: BL21‐AmpC (untreated) and orange: BL21‐AmpC (2 μg ml−1 ampicillin). Coloured cells correspond to compound peak intensities, with relative content for a given compound shown in red or blue to signify high and low values, respectively.
