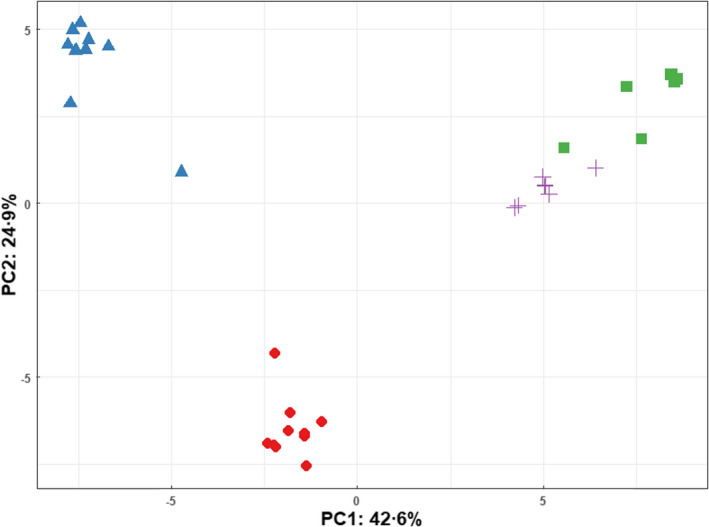
FIGURE 6.

Principal component analysis scores plot comparing Escherichia coli BL21 and BL21‐AmpC strains in the presence and absence of 2 μg ml−1 ampicillin‐supplemented media.  BL21 (2 μg ml−1 ampicillin), + BL21 (untreated),
  BL21‐AmpC (2 μg ml−1 ampicillin),
  BL21‐AmpC (untreated).
