FIGURE 7.

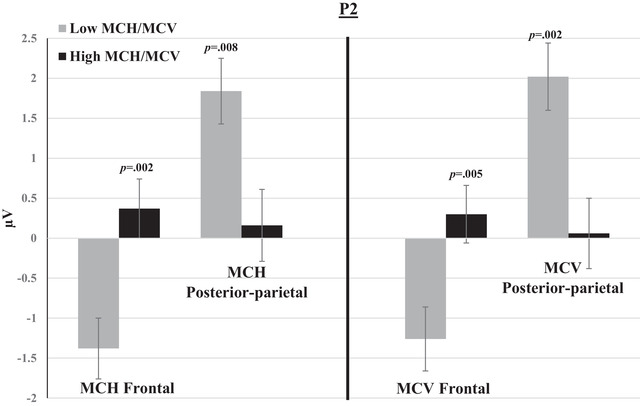
Mean amplitudes of P2 within groups of low and high MCH/MCV in posterior‐parietal and frontal channels. The switch and non‐switch conditions are combined. Error bars represent SEM.

Mean amplitudes of P2 within groups of low and high MCH/MCV in posterior‐parietal and frontal channels. The switch and non‐switch conditions are combined. Error bars represent SEM.