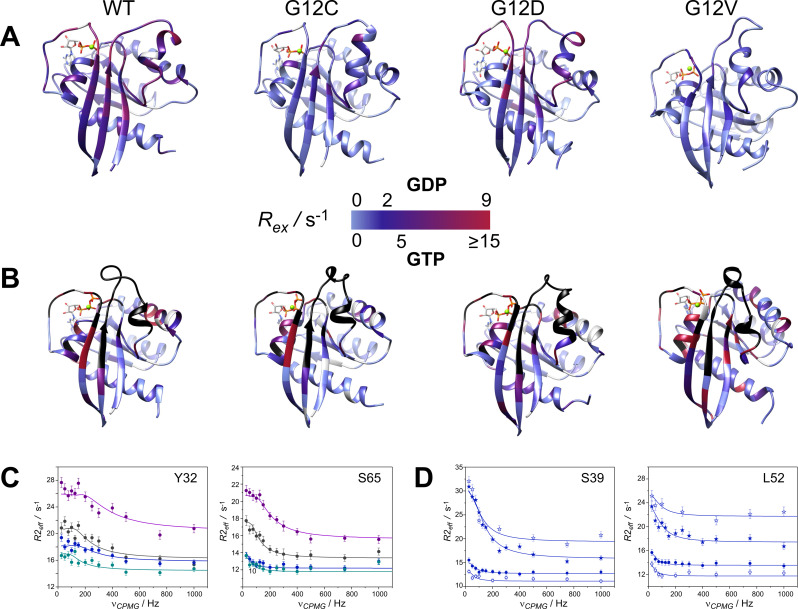
Figure 1.
Values of 15 N R ex (at 800 MHz for 1H) of the investigated 15 N‐labeled (A) K‐Ras ⋅ Mg2+ ⋅ GDP and (B) K‐Ras ⋅ Mg2+ ⋅ GTP variants (25 °C, pH 7.4) mapped on the corresponding MD‐derived structures ([36] and current study) in a blue‐to‐red gradient. R ex is estimated from the difference in R 2,eff at the lowest and highest ν CPMG values. Note the slightly different scale for GTP‐bound complexes for better viewing the differences between the investigated variants. Prolines and amino acid positions exhibiting a flat dispersion profile are colored in grey. Unassignable residues due to severe line broadening in the GTP‐bound state are colored in black. Transverse relaxation dispersions of the backbone 15 N nuclei of representative residues of (C) the switch‐I (Y32) and the switch‐II (S65) regions in wild‐type (black), G12C (blue), G12D (magenta), and G12V (aqua) K‐Ras ⋅ Mg2+ ⋅ GDP and (D) the switch‐I region (S39) and β3 preceding switch‐II (L52) in GDP‐ (circle) and GTP‐bound (star) forms of G12C K‐Ras ⋅ Mg2+ as a function of CPMG B1 field strength at static magnetic fields of 14.1 T (open symbols) and 18.8 T (closed symbols). Solid lines correspond to global two‐state exchange models with parameters listed in Table 1.

