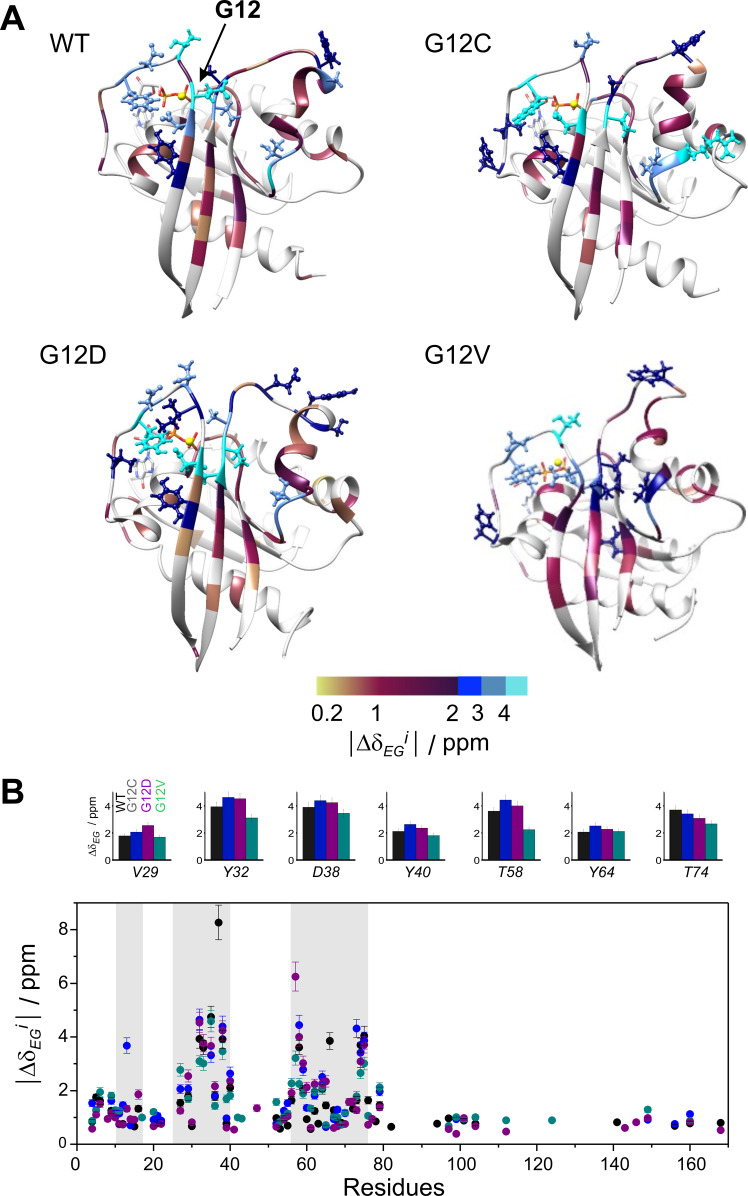
Figure 2.
Backbone 15 N chemical shift differences between the ground and higher energy state (|Δδ EG i|) as derived from CPMG relaxation dispersion measurements of the investigated GDP‐bound K‐Ras variants with parameters listed in Table 1. (A) Values of |Δδ EG i| are mapped on the ribbon diagram of the corresponding MD‐derived structures ([36] and current study). Residues exhibiting |Δδ EG i| exceeding 2 ppm are highlighted in a ball‐and‐stick representation for better viewing. Prolines and amino acid positions exhibiting a flat dispersion profile or with no available data are colored in grey. The site of the mutation is indicated by arrow. (B) Values of |Δδ EG i| as a function of amino acid sequence in wild‐type (black), G12C (blue), G12D (purple), and G12V (green) K‐Ras ⋅ Mg2+ ⋅ GDP. For representative residues, |Δδ EG i| in the investigated K‐Ras variants are shown in large at the top. Regions of the P‐loop, switch‐I, and switch‐II are highlighted in a grey background.

