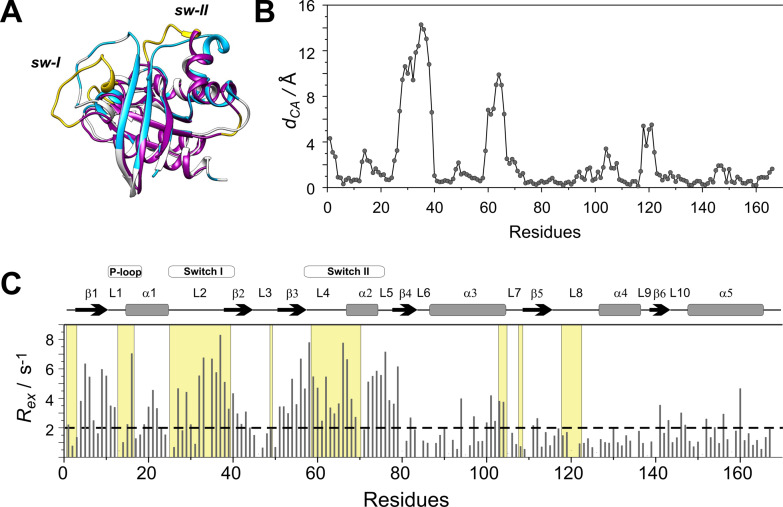
Figure 3.
(A) Superimposed structures of K‐Ras ⋅ Mg2+ ⋅ GDP (MD derived structure [36] ) (grey) and the nucleotide free H‐Ras ⋅ Sos compex (PDB: 1BKD, magenta). Regions displaying Cα positional differences larger than 2 Å between the two complexes are highlighted in yellow. Residues exhibiting a contribution to transverse relaxation of R ex >2 Hz in K‐Ras ⋅ Mg2+ ⋅ GDP are depicted in blue. (B) Cα positional differences between K‐Ras ⋅ Mg2+ ⋅ GDP and H‐Ras ⋅ Sos along the amino acid sequence. (C) Values of 15 N R ex (at 800 MHz for 1H) of 15N‐labeled wild‐type K‐Ras ⋅ Mg2+ ⋅ GDP (T=25 °C, pH 7.4) as a function of amino acid sequence. R ex is estimated from the difference in R 2,eff at the lowest and highest νCPMG values. Secondary structural elements are indicated at the top. Regions displaying d CA>2 Å in (B) are shown in a yellow background.

