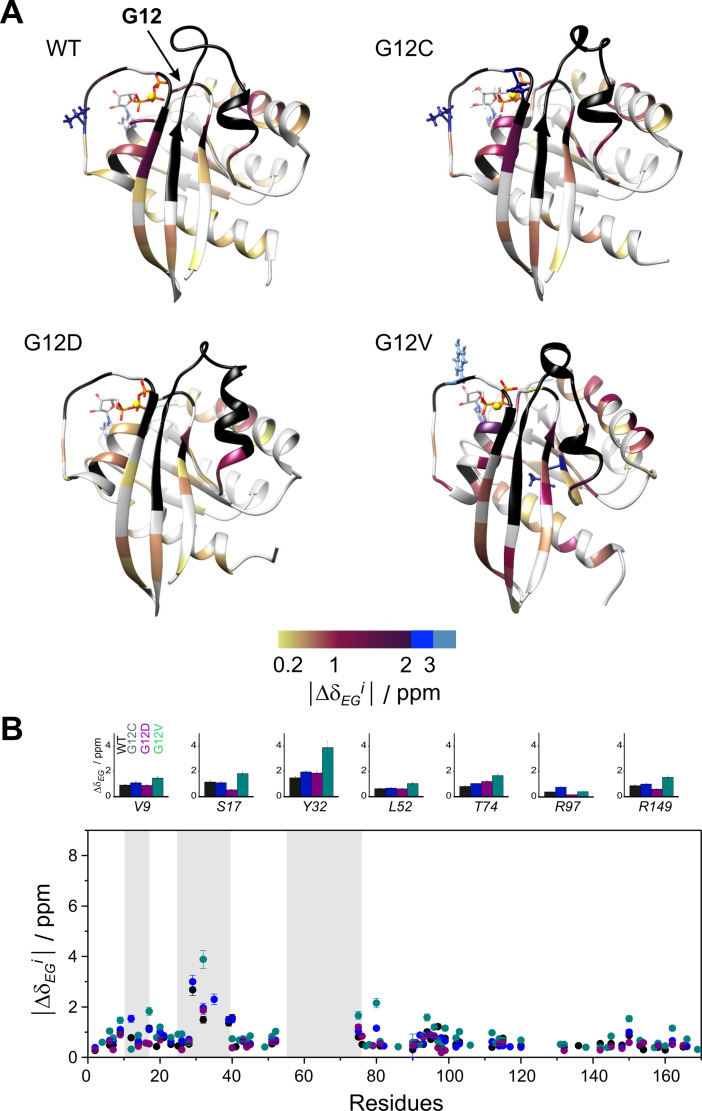
Figure 4.
Backbone 15 N chemical shift differences between the ground and higher energy state (|Δδ EG i|) as derived from CPMG relaxation dispersion measurements on the investigated GTP‐bound K‐Ras variants with parameters listed in Table 1. (A) Values of |Δδ EG i| are mapped on the ribbon diagram of the corresponding MD‐derived structures ([36] and current study). Residues exhibiting |Δδ EG i| exceeding 2 ppm are highlighted in a ball‐and‐stick representation for better viewing. Prolines and amino acid positions exhibiting a flat dispersion profile or with no available data are colored in grey. The site of the mutation is indicated by arrow. Unassignable residues due to severe line broadening are colored in black. (B) Values of |Δδ EG i| as a function of amino acid sequence in wild‐type (black), G12C (blue), G12D (purple), and G12V (green) K‐Ras ⋅ Mg2+ ⋅ GTP. For representative residues, |Δδ EG i| in the investigated K‐Ras variants are shown in large at the top. Regions of the P‐loop, switch‐I, and switch‐II are highlighted in a grey background.

