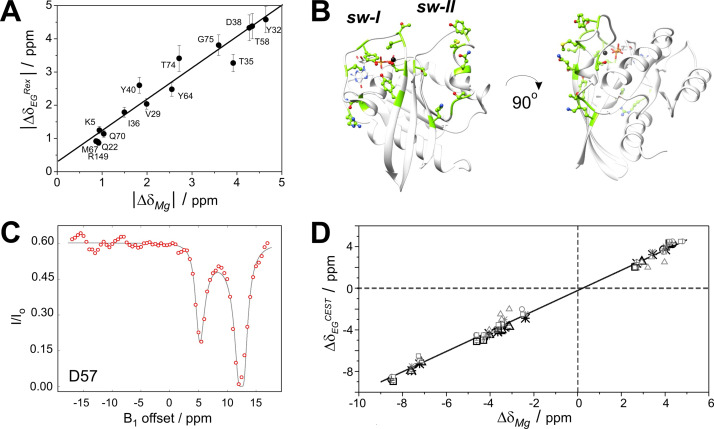
Figure 6.
Conformational exchange in GDP‐loaded K‐Ras. (A) Correlation between 15 N backbone chemical shift differences deduced from relaxation dispersion measurements (CPMG) on G12C K‐Ras ⋅ Mg2+ ⋅ GDP (|Δδ EG|) and those detected between the Mg2+‐bound and Mg2+‐free form (|Δδ Mg|) of the complex. (B) Residues exhibiting a linear correlation between |Δδ EG| and |Δδ Mg| are indicated in green in a ball‐and‐stick representation on the ribbon diagram of G12C K‐Ras ⋅ Mg2+ ⋅ GDP. (C) Plot of the fit of the 15 N‐CEST experiment for a representative residue at the beginning of the switch‐II region (β3) in wt K‐Ras ⋅ Mg2+ ⋅ GDP. Numerical parameters of the fit are shown in Table 2. (D) Correlation between 15 N backbone chemical shift differences deduced from CEST experiments on wt (star), G12C (circle), G12D (triangle), and G12V (square) K‐Ras ⋅ Mg2+ ⋅ GDP (Δδ EG CEST) and those detected between the corresponding Mg2+‐bound and a Mg2+‐free forms (Δδ Mg). Fitted and estimated (based on the difference between the two minima of the CEST‐curve) values of Δδ EG CEST are depicted in darker and lighter color, respectively.

