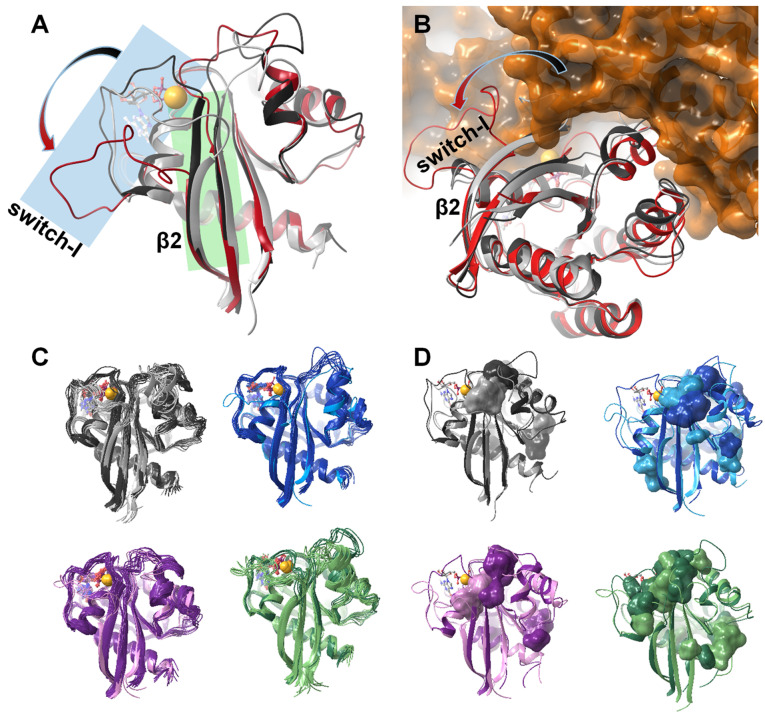
Figure 7.
(A) Gradual shortening of the β2 strand (highlighted in green) and the opening of the switch‐I region (highlighted in blue) as the Mg2+ ion and the nucleotide is removed from the resting state of the Ras‐complex: comparing the structure of K‐Ras‐wt ⋅ Mg2+ ⋅ GDP fully intact complex (dark grey) with that of the GDP‐bound Mg2+‐free K‐Ras‐wt (light grey); in both cases the mid‐structure of the most populated cluster of the MD simulation is shown. The Mg2+‐free H‐Ras structure extracted from the crystal structure of the H‐Ras‐GEF (Sos1) complex (PDB code: 1xd2, [51] red) is shown for comparison. (B) Opening of the switch‐I region is a significant step of GDP release and the subsequent GDP↔GTP exchange: binding of GEF is only possible in the presence of the fully open conformer seen in the crystal structure of the H‐Ras‐GEF (Sos1) complex (PDB code: 1xd2, [51] H‐Ras shown in red, GEF in orange). The most populated cluster of the MD simulation of wt K‐Ras ⋅ Mg2+ ⋅ GDP (dark grey) and GDP‐bound Mg2+‐free K‐Ras‐wt (light grey) are also shown. (C) Comparison of the MD derived ensembles of GDP‐bound K‐Ras‐wt (grey), G12C (blue), G12D (purple), G12V (green) in the Mg2+‐bound (dark colors) and Mg2+‐free states (light colors); cluster mid structures of each cluster required for representing >95 % of the snapshots – thus the number of conformations shown corresponds to the heterogeneity of the equilibrium ensemble of each state. (D) Small‐molecule binding pockets (as calculated by the FTMap server [58] ) of each studied system illustrating the alteration of the surface landscape due both to Mg2+‐loss and the oncogenic mutations (colors are the same as in (C)).

