
FIGURE 4.
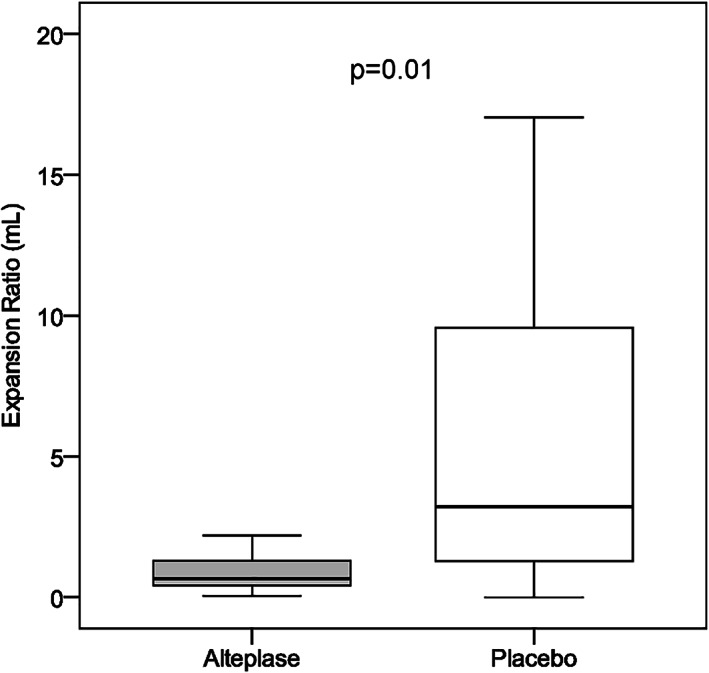
Effect of adjunct intra‐arterial alteplase on brain imaging surrogate markers. Imaging surrogate markers in patients treated with alteplase (n = 17) or placebo (n = 19) are shown in box‐whisker plot of infarct expansion ratio according to study treatment (boxes indicate 25–75% interquartile range [IQR]; central horizontal bars indicate median; outer horizontal bars indicate 10–90% IQR).