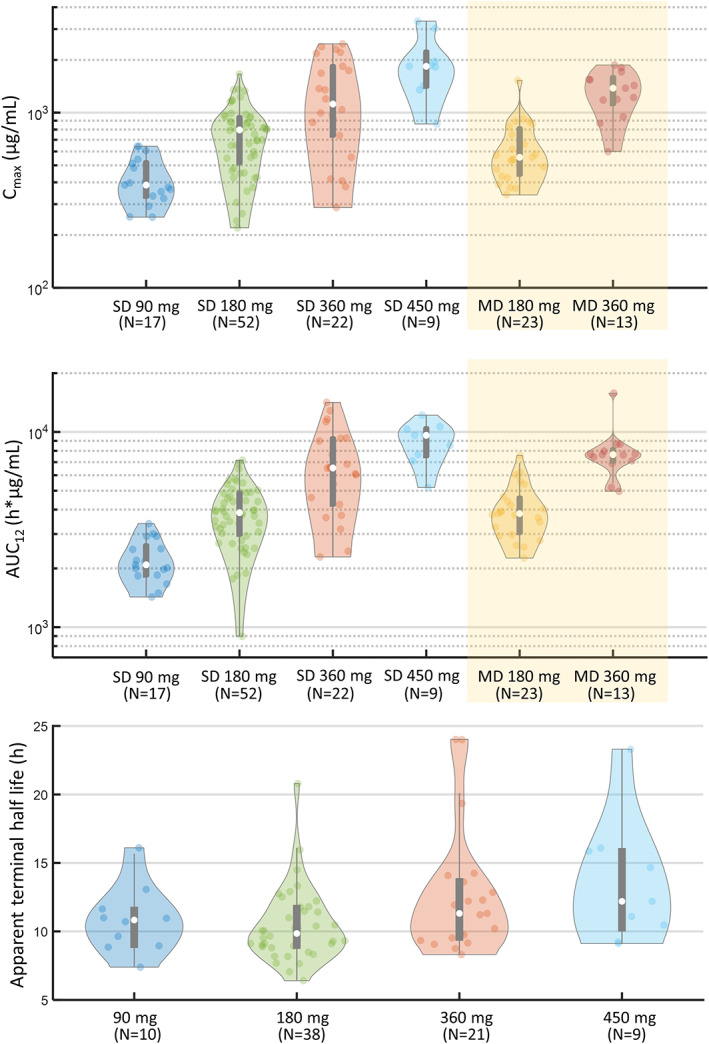
FIG 2.

Overview of PK (pharmacokinetic) data from the UCB0599 phase 1/1b studies. Violin plots show the distribution of data in each group. Medians (white spots), interquartile range delimited by 25th and 75th percentiles (violin plot), 1.5 × interquartile range (whiskers), and individual data are shown. Across the studies, a linear, time‐independent, PK profile was observed, and the PK of multiple doses of UCB0599 were predictable from single‐dose exposures. AUC, area under the plasma concentration–time curve; C max, maximum plasma concentration; PK, pharmacokinetics; MD, multiple dose; MD 180 mg at steady state (twice daily dosing 90 mg and includes data from UP0030 and UP0077); MD 360 mg at steady state (twice daily dosing 180 mg and includes data from UP0077 only); SD, single dose.
