
Figure 2: Ruminococcaceae Subdoligranulum strains isolated from a human sample are targeted by PB-mAbs and stimulate CD4+ T cells from patients with RA.
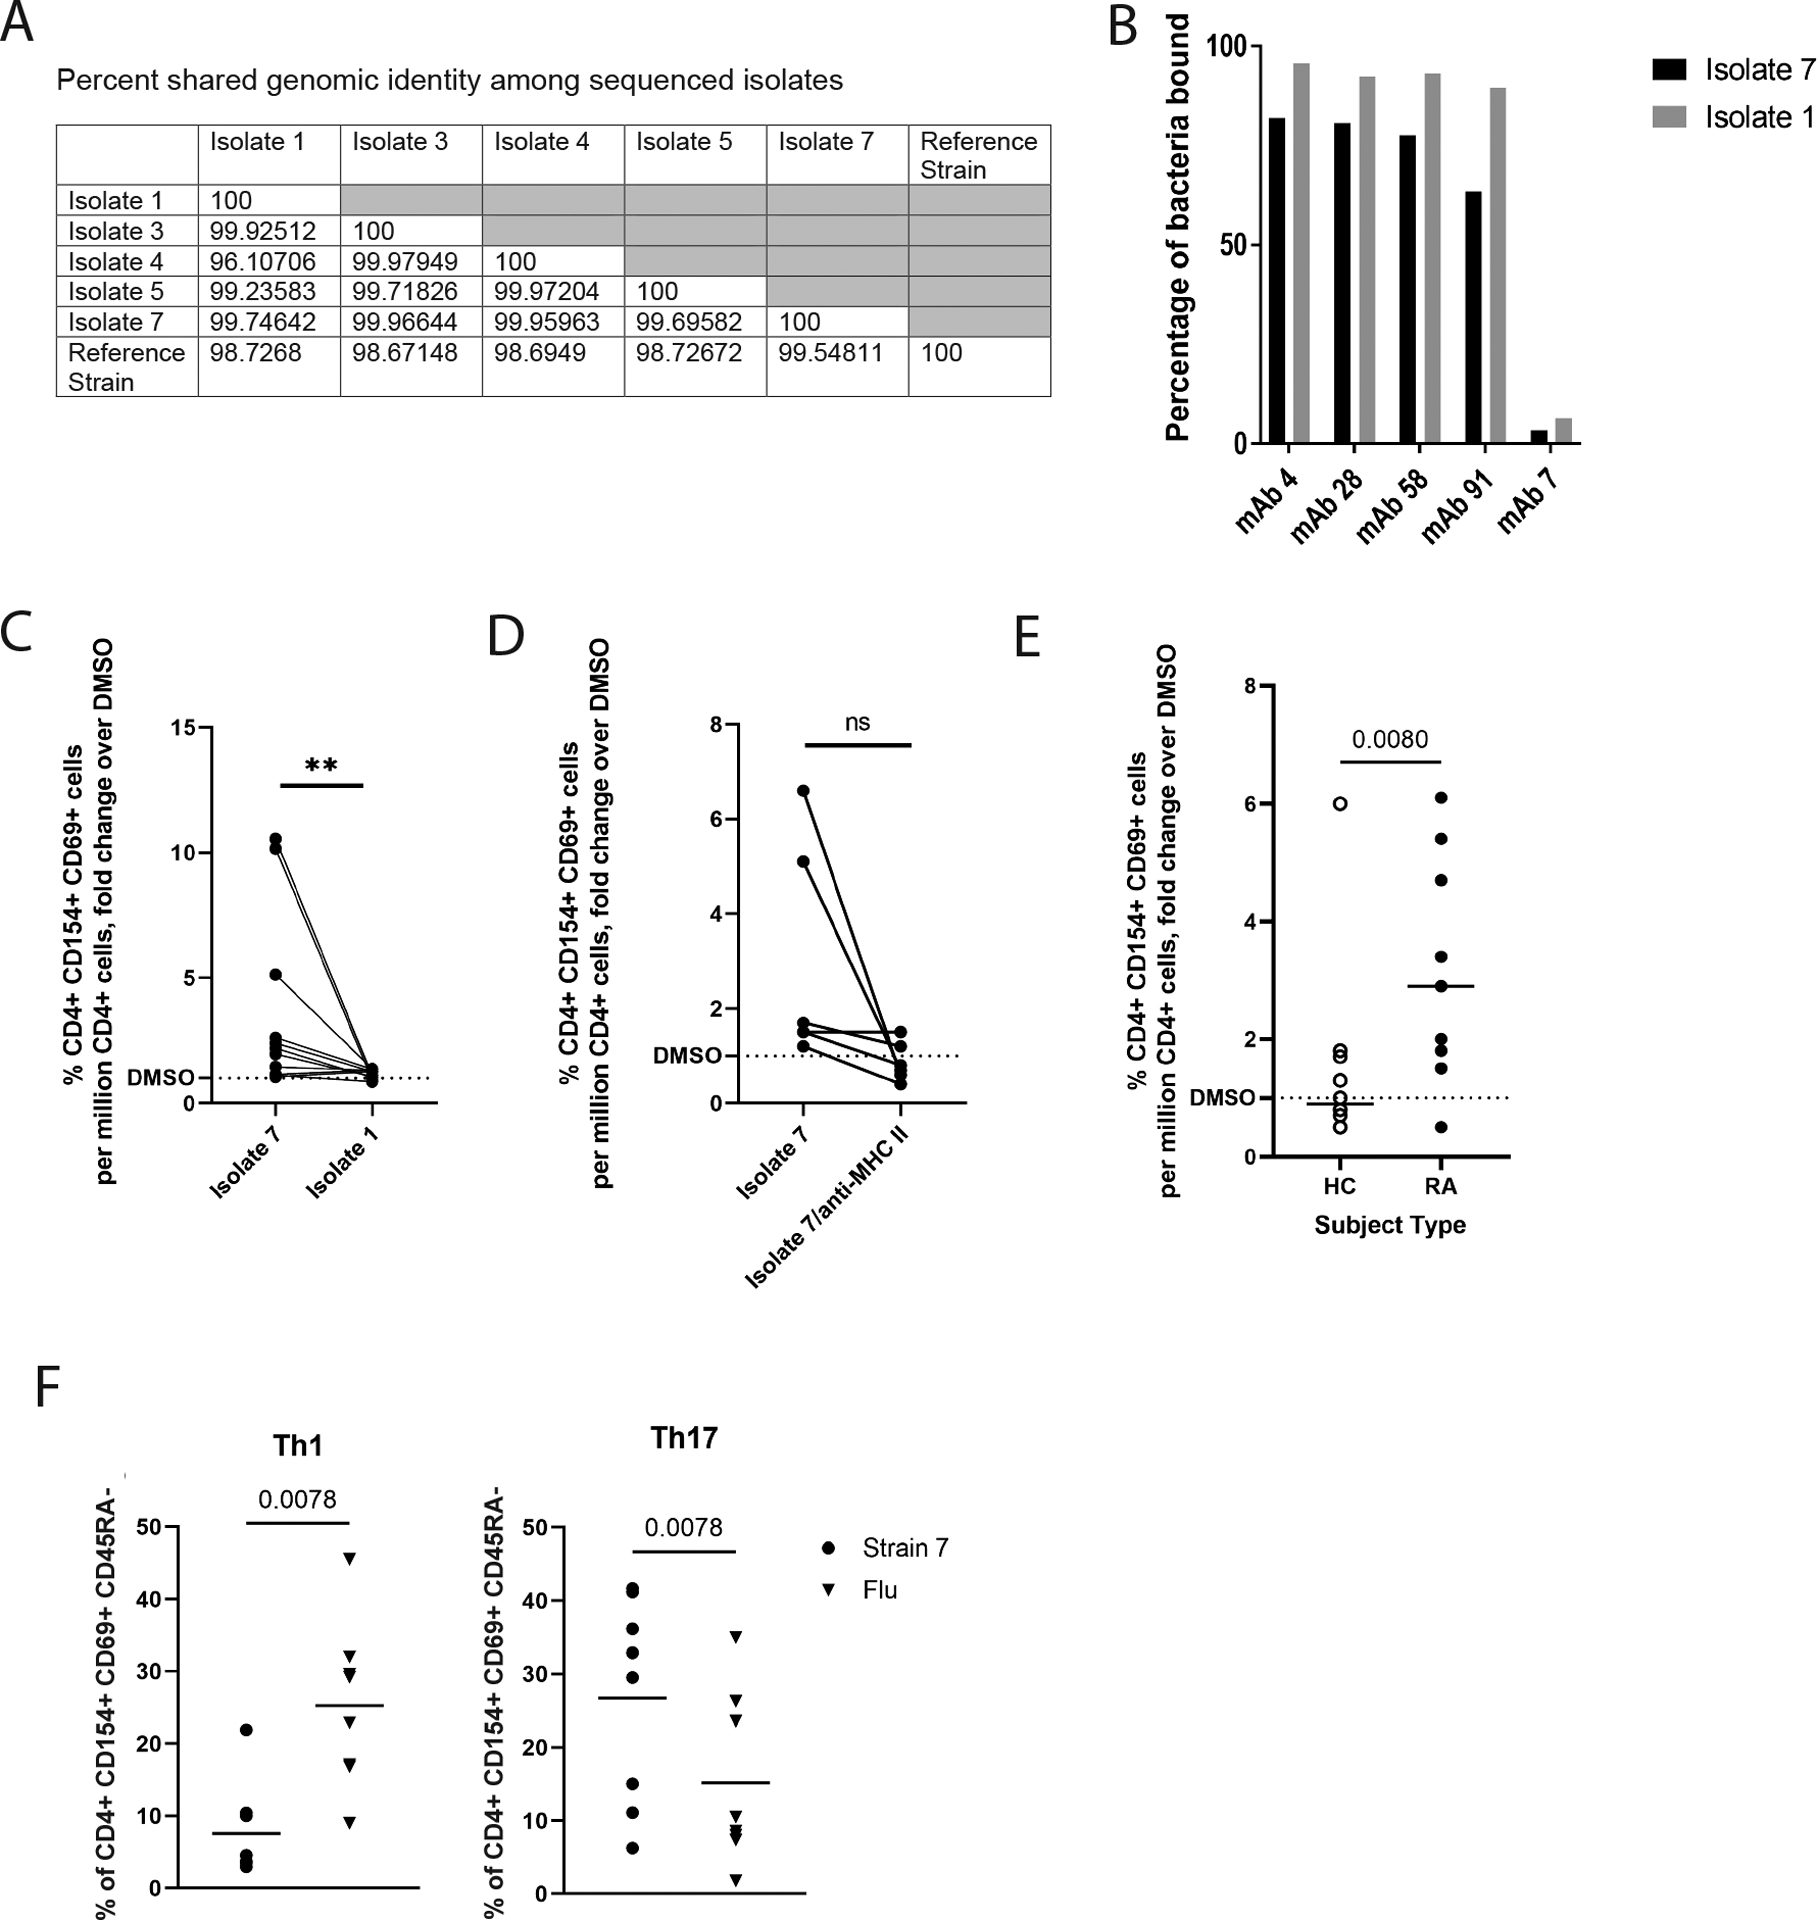
(A) Seven primary strains of Ruminococcaceae Subdoligranulum were isolated from the feces of an individual. Five isolates were selected for short read genome sequencing based on taxonomic identification by 16S rRNA sequencing. The table represents percent genomic shared identity among the 5 isolates as well as against a reference genome found to be genetically aligned (MGYG-HGUT02424; unidentified genus in Order Clostridiales, which includes Lachnospiraceae and Ruminococcaceae). (B) Isolates 1 and 7 were matched against four selected PB-mAbs (numbers 4, 28, 58, and 91) that bound highly to other various patterns of Ruminococcaceae and Lachnospiraceae species to verify that they targeted the strains. They were also matched against a control mAb (number 7) that was previously found to not bind bacteria. The percent of bacteria bound to mAb is displayed (y-axis) against each selected mAb (x-axis). Binding by isolate 7 is shown in black, and binding to isolate 1 is shown in gray. (C) Human peripheral blood mononuclear cells (PBMCs) from individuals with RA (n=11) were stimulated with 50ng/ml isolates 1 or 7. Fold change of the CD4+ T cell response relative to DMSO (horizontal dotted line) is displayed against binding to isolates 1 and 7 (x-axis). **P<0.01, non-parametric Wilcoxon matched-pairs signed rank test. (D) A Class II HLA-DR (clone L243) blocking antibody or an equal volume of phosphate-buffered saline was applied at 20μg/mL for 30 minutes prior to stimulation of PBMCs from individuals with RA (n=5) with isolate 7. Fold change of the CD4+ T cell response relative to DMSO (horizontal dotted line) is displayed against binding to isolate 7 versus isolate 7 blocked with L243 (x-axis). ns, not significant by non-parametric Wilcoxon matched-pairs signed rank test. (E) Isolate 7 specific responses among CD4+ T cells was tested comparing CD4+ T cells isolated from individuals with RA (n=11) to CD4+ T cells isolated from healthy controls (n=12). Fold change of the CD4+ T cell response relative to DMSO (y-axis) is displayed (x-axis). Data were analyzed using a nonparametric Mann-Whitney test. (F) Left: using CD45RA−/CXCR3+/CCR4−/CCR6− as a defining marker combination, we compared the relative proportion of Th1-like cells for Isolate 7-specific (circles) or influenza-specific (inverted triangles) memory CD4+ T cell responses in CD4+ T cells from individuals with RA, observing a higher proportion of Th1-like influenza specific cells (p=0.0078, nonparametric Mann-Whitney test). Right: using CD45RA-/CXCR3-/CCR4+/CCR6+ as a defining marker combination, we compared the relative proportion of Th17-like cells for Isolate 7-specific (circles) or influenza-specific (inverted triangles) memory CD4+ T cell responses, observing a significantly higher proportion of Th17-like isolate 7-specific cells (p=0.0078, nonparametric Mann-Whitney test). Horizontal bars indicate mean.