Figure 4.

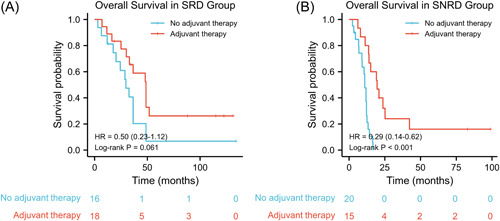
Kaplan–Meier curves of overall survival stratified by adjuvant therapy (A) in the surgery response disease (SRD) group; (B) in the surgery nonresponse disease (SNRD) group

Kaplan–Meier curves of overall survival stratified by adjuvant therapy (A) in the surgery response disease (SRD) group; (B) in the surgery nonresponse disease (SNRD) group