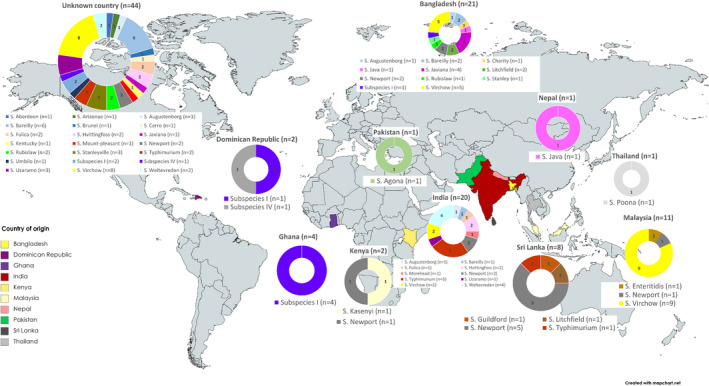
FIGURE 1.

Distribution of Salmonella serovars recovered from imported edible leaves by country of origin during 2014–2019. World map of countries of imported leaves into England and different Salmonella serovars isolated. Figure shows that a variety of serovars were isolated from different countries and variety increased along‐side the sampling volume.
