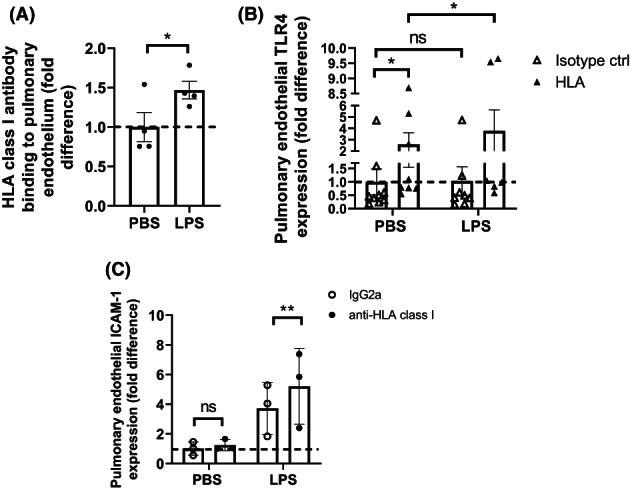
FIGURE 1.

Surface expression of HLA on pulmonary ECs is enhanced by LPS, leading to enhanced TLR4 and ICAM‐1 expression upon HLA class I antibody binding (a) quantification of HLA‐ABC surface expression after treatment of pulmonary ECs with PBS or 10 ng/ml LPS as measured with FACS. All PBS‐treated data points were divided by their average to indicate variation. All LPS datapoints were divided by PBS‐treated data points for fold difference (1.5 ± 0.2). Dotted line indicates 1‐fold. A ratio‐paired T‐test was used to determine statistical significance. ns = non‐significant, * = p < .5, n = 4. (B) Quantification of TLR4 surface expression after treatment of pulmonary ECs with PBS or 10 ng/ml LPS and 10 μg/ml anti‐HLA class I or isotype control, as measured with FACS. All PBS + IgG2a‐treated data points were divided by their average to indicate variation. All anti‐HLA class I and LPS datapoints were divided by PBS + IgG2a‐treated data points for fold difference (fold increase PBS + anti‐HLA class I 2.6 ± 1.0, LPS + anti‐HLA class I 3.8 ± 1.8). Dotted line indicates 1‐fold. A Wilcoxon‐rank paired T‐test was used to determine statistical significance. ns = non‐significant, * = p < .5, n = 5. (C) Quantification of ICAM‐1 surface expression after treatment of pulmonary ECs with PBS or 10 ng/ml LPS and 10 μg/ml HLA‐ABC or isotype IgG2a antibodies as indicated and measured with FACS. All PBS + IgG2a‐treated data points were divided by their average to indicate variation. All LPS datapoints were divided by PBS + IgG2a‐treated data points for fold difference. LPS + IgG2a (3.7 ± 1.0) and LPS + anti‐HLA class I (5.2 ± 1.5) increase compared to PBS + IgG2a. Dotted line indicates 1‐fold. The ratio‐paired T‐test was used to determine statistical significance. ns = non‐significant, ** = p < .01, n = 3
