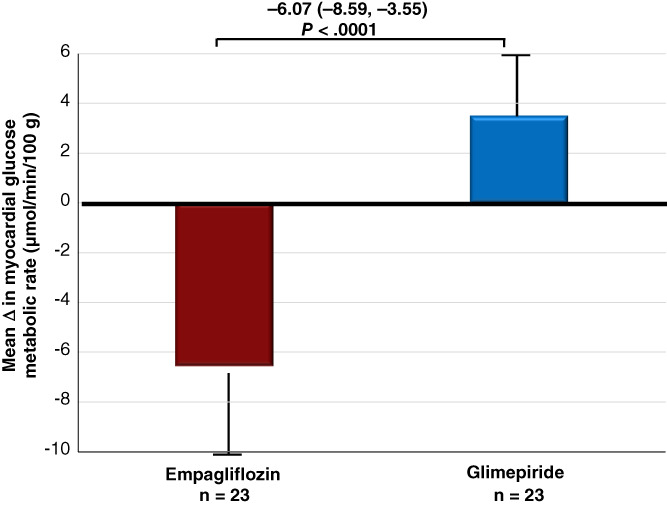
FIGURE 1.

Changes in myocardial glucose metabolic rate after exposure to empagliflozin or glimepiride for 26 weeks. Data are means ± SD, and analysed using ANCOVA adjusting for baseline values. The mean change in myocardial glucose metabolic rate is presented as mean (95% CI), and the adjusted difference between the groups is shown with 95% CI
