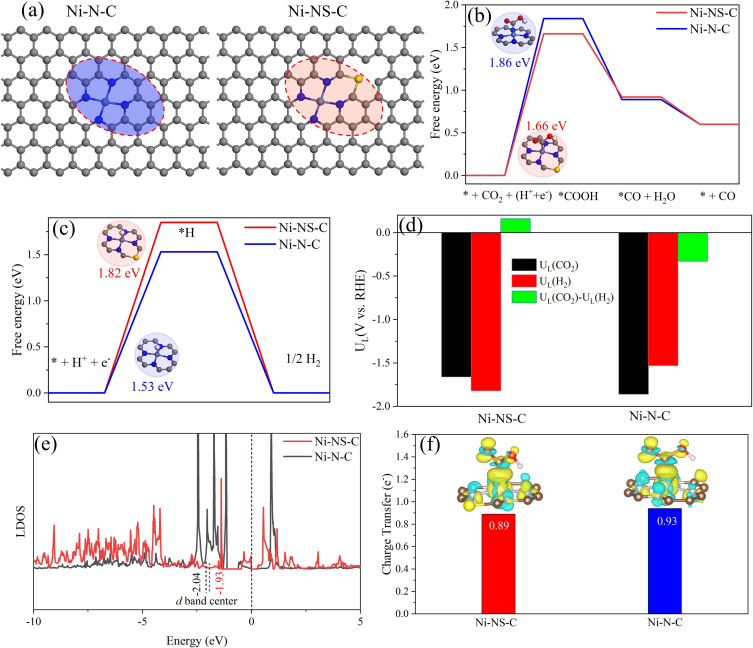
Figure 7.
(a) Atomic structure of proposed Ni−N−C and Ni−NS−C catalysts; (b) free energy diagrams for ECR to CO; (c) free energy diagrams for HER; (d) difference between the limiting potentials for ECR and HER; (e) location of d band center; (f) charge density difference after *COOH adsorption on Ni−N−C and Ni−NS−C catalysts, the isosurface value is set to be 0.003 e Bohr−3.

