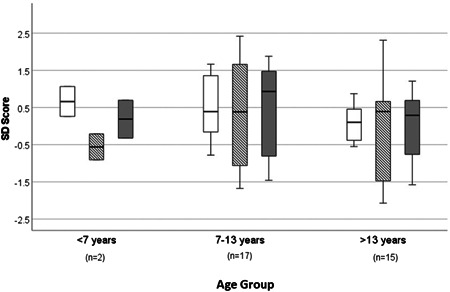
Figure 2.

Auxological parameters (BMI SDS [unshaded bars], height SDS [hatched bars] and weight SDS [grey bars]) for all patients by age group represented as box plot—median and interquartile range. BMI, body mass index; SDS, standard deviation scores.
